Download
1 / 42
420 likes | 588 Views
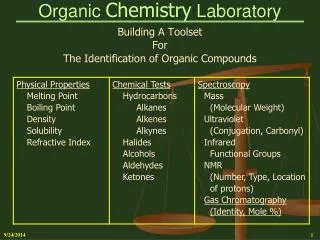
Part 5: Introduction to Spectroscopy for Chemical Analysis. KR LSU. FYI-REVIEW: What we know? What we want to know? Chemical analysis and spectrophotometry : using radiation objects (light) to measure molecular concentrations. Basic components of spectroscopic instrumentation:

E N D
Part 5: Introduction to Spectroscopy for Chemical Analysis KR LSU
FYI-REVIEW: What we know? What we want to know? • Chemical analysis and spectrophotometry: using radiation objects (light) to measure molecular concentrations. • Basic components of spectroscopic instrumentation: • Light sources, • Wavelength selection devices, • Detectors, • Basic methods of measurements, absorption and emission etc. • .. and we also want to know how to present results of measurements: mean values and uncertainty in Spectrophotometry
FYI: Simple picture: radiation objects move from left to right, the electromagnetic field oscillates up-down Radiation Objects: origin from interaction with material objects (electrons, protons, atoms, molecules….)
How do we know that light can be described through wave-like observables: From experiments
FYI: Radiation objects, also known as photons, can be described using physical properties or observables such as wavelength, frequency, energy, momentum, polarization etc. Physical observables are obtained from physical measurements of physical objects. Physical observables can be related to each another, depending on the way experiments measure those objects: wavelength is related to frequency, frequency to energy etc. The so called wave-like observables can be related to the particle-like observables.
IMPORTANT: Light as well as electrons can be described through what we sometimes call wave-like physical observables • Waves are described by wavelength,l, amplitude,A and frequency, n. The frequency, n, of a wave is the number of cycles which pass a point in one second. • The speed of a wave, c, is given by its frequency multiplied by its wavelength: Speed ( c ) = nl • C = 2.9979 * 108 m/s (in vacuum)
IMPORTANT: Relationship between physical observables: frequency and wavelength:C= l * nyellow light : l =589nmfrequency n = c/n ==(2.99799 *10 8 m/s/ 589nm) (1nm/10-9 m)== 5.09 *1014s-1
FYI: Electrons in Atoms: Spectroscopic Investigations and Line Spectra (Hydrogen Atom) Line Spectra Radiation composed of only one wavelength is called monochromatic. Radiation that spans a whole array of different wavelengths is called continuous. White light can be separated into a continuous spectrum of colors.
electromagnetic radiation objects: different physical properties ------IMPORTANT Radiation composed of only one wavelength = monochromatic (one color). Radiation that spans a whole array of different wavelengths = continuous. White light = continuous spectrum of colors. Dark= no light.
RO originate from interactions with material objects (electrons, protons, atoms, molecules ..) When light interacts with material it can be transmitted, reflected, scattered, absorbed emitted. Depending on the material, the interaction with different radiation will be different.
Photons are coming from individual events. Energies of photons emitted from (or interacting with) electrons in atoms are quantized : **This is similar to some other (wave-like) systems: musical instruments (piano) etc.
FYI: Each interaction event between radiation objects and material objects can be described with particle-like observables: Radiation objects (photon) detected in individual events. (DEMOS)
IMPORTANT: Relationship: energy and frequencyEnergy of yellow photons of 589nm:E=h * n = h * (c/l ) = (6.63 810-34 Js) *(5.09 1014s-1)=3.37*10-19 JFor: 1 2 3 ……..photons: 1 hn 2 hn 3 hn……. energy 1*3.37*10-19 J 2*3.37*10-19 J 3 3.37*10-19 J
The general paradigm of spectrophotometry:counting molecules with photons!How???Atoms, molecules, ions absorb or emit photons!In a single photon regime it is 1: 1, one photon for one molecule of compound, or 1 mole of absorbed photons per one mole of affected compound molecules! (“Titration with photons”
FYI: Rydberg’s analysis of atomic line spectra (Na,H): RH= 2.18 10-18 J *observables using h constant Movie colors of alkali metals
IMPORTANT: Main principle of spectrometry for chemical analysis • If ONE radiation objects is observed from the interaction with ONE material object then we are in the position to count material objects using radiation objects at the atomic, electronic or molecular accuracy.
Absorption and Absorbance Instrumental configurationand definitions
IMPORTANT: BASIC COMPONENTS OF SPECTROSCOPIC INSTRUMENTS (and absorption as an example) -sources of radiation objects (continuum and discrete lamps, lasers, ..) -selection of radiation objects (filters, monochromators, interferometers, tunable lasers..) -detectors (different wavelength range photon transducers-phototube, PMT, photodiode, photoconductor, photovoltaic cell, thermocouple, thermistor, pyroelectric, etc. image detectors -signal processor (electronics, computers..)
IMPORTANT Radiant power, P, ~ energy per second per unit area of a light beam When light is absorbed by a sample, the radiant power of the light beam decreases. Transmittance, T, ~ fraction of the original light that passes through a sample. T = P/Po and T has the range of 0.0 – 1.0 Absorbance, A, is related to transmittance. A = log10(Po/P) = –log10T
Cont. • Absorbance is more useful quantity because it is directly proportional to the concentration, C, of the light absorbing species in the sample. • A k C • An absorption spectrum is a graph showing how A varies with l.
Exponential decrease natural logarithm dependence Absorbance dependence on the number of molecules/atoms (Beer’s law) FYI • dP/P = e c dx • - Integral ( dP/P )(from Po to P) = e * c * Int (dx) (from 0 to b) • -lnP –(-ln Po) = e c b or ln(P0/P) = e c b • What if small concentration or short legth?????
Beer's Law ( Beer-Lambert Law) A = e b C where c is the concentration (M), b is the path length (cm), and e is the molar absorptivity (M–1 cm–1). e is wavelength dependent. Beer's Law works for dilute (~ 0.01 M) solutions in which the absorbing species is not participating in a concentration-dependent equilibrium.
For Quantitative Analysis • Absorbance should not be too large or small(~0.4-0.9 units) • Absorbance should be measured at dA/d 0; at the lambda max providing no interference from other species at this lambda. • Monochromator bandwidth should be as large as possible but small compared to the spectral bandwidth. Slit width to small allows less light to reach the analyte, smaller S/N ratio and precision. Too wide a monochromator band width (slit width) distorts the peak shapes of the spectrum. • A As shown in the figure above; the instrumental setting with the band width at 0.1 nm and the choice of 609 nm for max would be desirable for the spectra shown. At the 2.0 nm setting there is no fine structure shown in this spectrum.
EXPERIMENTAL PARAMETERS : how to get the most from measurements with absorption spectroscopy C Choice of the Wavelength and Bandwidth –
Conditions • What characteristics we need for absorption spectrophotometers? • · Most spectrophotometers operate best at values for A 0.4 – 0.9 • · If absorbance too high, intensity is hard to measure. • · If absorbance too low, hard to distinguish between reference and sample
FYI (cont.) • Slight mismatches between reference and sample cuvettes leads to systematic error • · Samples must be dust free. Cuvettes must be wiped clean before use.
Example At a given wavelength, a cuvet filled with a sample solution has a transmittance of 63.1%. A reference cuvet filled with the solvent has a transmittance of 94.7% at that same wavelength. What is the corresponding absorbance of the sample? A = –log10 T so Asample = –log(0.631) = 0.20 Aref = –log(0.947) = 0.02 Acorrected = Asample – Aref = 0.20 – 0.02 = 0.18
Example A 0.267 g quantity of a compound with a molecular weight of 337.69 g/mol was dissolved in 100 mL of ethanol. Then 2.000 mL was withdrawn and diluted to 100 mL. The spectrum of this solution exhibited a maximum absorbance of 0.728 at 438 nm in a 2.000-cm cell. What is e? A Procedure for Constructing a Calibration Curve Step #1. Prepare known samples of analyte, covering a convenient range of concentration, and measure the response of the analytical procedure to these standards. Step #2. Subtract the average response of the three blank samples from each measured responses to obtain the corrected response. The blank measures the response of the procedure when no analyte is present. Step #3. Make of graph of corrected response vs. quantity of analyte analyzed.
Example: the following information is obtained during absorbance measurements at 427 nm. standards corrected blank Absorbance conc(M) Abs readings readings readings 0.1 0.89 0.008 0.898 0.05 0 .47 0.01 0.48 0.01 0.079 0.0089 0.0879 0.005 0.04 0.009 0.049 0 0
FYI : Some additional information not included in this course
Relations between observablesare similar for both material and radiation objects: Photoelectron experiments Compton: electron –photon scattering Laue, Bragg: X-rays: photon diffraction Electron diffraction Black body radiation, etc. E = h n where h is Planck’s constant (6.626 10-34 J.s). The momentum, mv, is a particle-like observable, where as is a wave-like observable. In this equation de Broglie presented the relation between the observables of waves (wavelength) and particles as they apply to observables mass and speed (velocity ) of objects.
FYI: Relationship: wavelength and velocity of electronselectron velocity v=5.97* 106m/s electron mass me = 9.11* 10 –28 gl= h/(m *v)=(6.63 810-34 Js) /(5.97* 106m/s *9.11* 10 –28 g)( (1kg m2/s2)/1J) * (103g/1kg)=1.22 10-10 m =0.122nm
FYI: Relationships between observables and interactionsEnergy (E)and time (t), momentum (m*v) and position(x) have also relationships:We can write them as: dE * dT > hdp *dx > h*uncertainty principles/relations