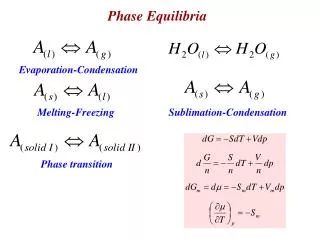
Phase Equilibria
Phase Equilibria. Bt-2253 Chemical Thermodynamics and Bio Thermodynamics Parthasarathi Subramanian, Assistant Professor, Dept. of Biotechnology, Vel Tech High Tech Engg . College. To download: www.sweetsarathi.wordpress.com. Goals:.

Phase Equilibria
E N D
Presentation Transcript
Phase Equilibria Bt-2253 Chemical Thermodynamics and Bio Thermodynamics Parthasarathi Subramanian, Assistant Professor, Dept. of Biotechnology, Vel Tech High Tech Engg. College. To download: www.sweetsarathi.wordpress.com
Goals: • Learn definition and basic concepts of phase equilibria and phase diagrams. • Fully characterize the state of a material at a point on a phase diagram.
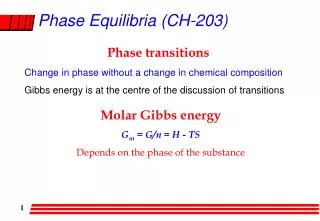
What is phase? • Homogeneous portion of a system • Uniform chemical and physical properties • Several phases may be present simultaneously Equilibrium (Thermodynamic Definition): • System is at equilibrium if its free energy is at a minimum. • If you change the temperature, pressure, or composition, the free energy will change.
Phase Equilibrium: • Consider a closed system comprising two phases- liquid and vapor. • System would be in thermal and mechanical equilibrium, another important equilibrium is phase equilibrium. • Examples: • Wet T-Shirt hanging in a open area dries, • Aftershave lotion in open bottle disappears. • There is a driving force between the two phases, that forces the mass to transform from one phase to another. • At constant temp and pressure, when two components are mixed well, equilibrium will attain without change in Gibb’s free energy.
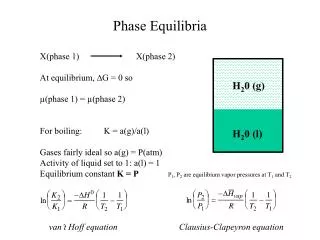
For a multi component system, • At constant temp and pressure, dG = 0 • This is the actual criterion of phase equilibrium. • For vapor liquid equilibrium, Gibbs free energy can be expressed as, G= GV + Gl as, dG= dGV+ dGl Where, GlGibbs free energy of saturated liquid phase, GvGibbs free energy of saturated vapor phase.
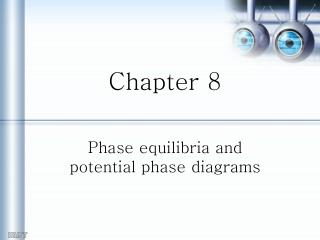
Gibbs phase rule • F = C + 2 – P • F is degree of freedom, • C is number of components • P is the number of phases.
For example, • Pure water boils at 100 deg, it has two phases. • Here P = 2 (Liq. and vapor phase) • C = 1 (Only water) • Then, the Gibbs phase rule, • F = C+2-P • F = 1+2-2 • = 1 • Here the Degree of freedom is 1. It denotes the phase change occurs with the change in one variable (either temperature or pressure).
Gibbs phase rule for Ethanol-water system: • C = 2 (ethanol and water), • P = 2 (liquid and vapor), • Then, • F = C + 2 – P • = 2 + 2 – 2. = 2. • Then the degrees of freedom is 2. • For practical situations, we could consider the variable pressure is atmospheric. • Another variable could either be a temperature or the composition.
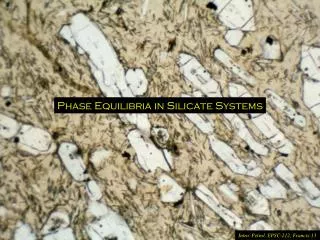
VLE of a binary system can be represented by three kinds of diagrams: • Temp-composition (T-x-y) diagrams, • Pressure-composition (P-x-y) diagrams, • Pressure-Temperature (P-T) diagrams. • Temperaure - Composition (T-x-y) diagram: • Graph is plotted temperature versus composition. • Diagram is also called “Boiling point diagram”. • We can understand how the equilibrium curve changes with the diagram.
Txy diagram for binary mixture (benzene and toluene) x axis is the mole fraction and y axis is temp. Upper curve is saturated vapor pressure curve or dew point curve, Bottom curve is saturated liquid curve or bubble point curve.
Region bound by two curves is two phase region (partially liquid and partially vapor). • At any point below the lower curve is liquid completely and vise versa. • Region below bubble point curve is sub-cooled region (sub cooled liquid)and above dew point curve is super heated region (super heated vapor).