Download
1 / 5
50 likes | 103 Views
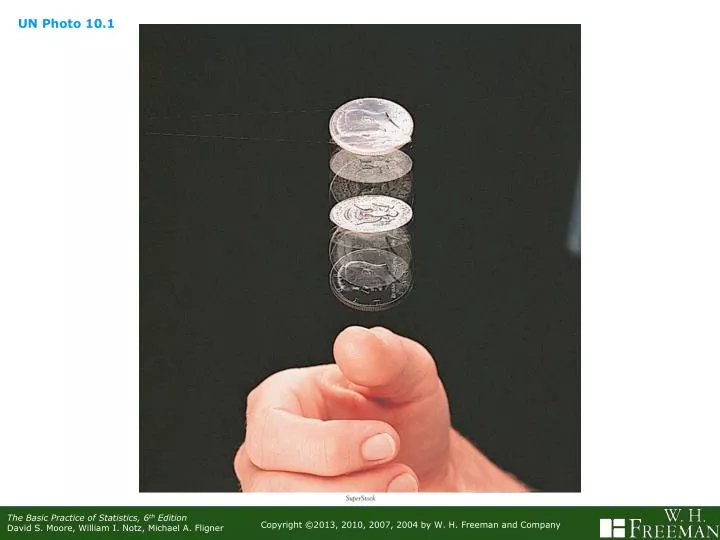
UN Photo 10.1. Figure 10.1 The proportion of tosses of a coin that give a head changes as we make more tosses. Eventually, however, the proportion approaches 0.5, the probability of a head. This figure shows the results of two trials of 5000 tosses each.

E N D
Figure 10.1 The proportion of tosses of a coin that give a head changes as we make more tosses. Eventually, however, the proportion approaches 0.5, the probability of a head. This figure shows the results of two trials of 5000 tosses each.
Figure 10.5 Probability as area under a density curve. The uniform density curve spreads probability evenlybetween 0 and 1.
Figure 10.6 The probability in Example 10.9 as an area under a Normal curve.