Download
1 / 18
180 likes | 214 Views
Learn how to compare two means in statistical practice with examples, assumptions, hypotheses, and calculation methods for confidence intervals and hypothesis testing.

E N D
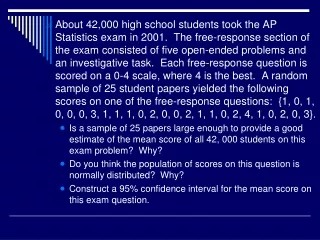
About 42,000 high school students took the AP Statistics exam in 2001. The free-response section of the exam consisted of five open-ended problems and an investigative task. Each free-response question is scored on a 0-4 scale, where 4 is the best. A random sample of 25 student papers yielded the following scores on one of the free-response questions: {1, 0, 1, 0, 0, 0, 3, 1, 1, 1, 0, 2, 0, 0, 2, 1, 1, 0, 2, 4, 1, 0, 2, 0, 3}. • Is a sample of 25 papers large enough to provide a good estimate of the mean score of all 42, 000 students on this exam problem? Why? • Do you think the population of scores on this question is normally distributed? Why? • Construct a 95% confidence interval for the mean score on this exam question.
Section 10.1 Inference for Two Means
Comparing Two Means • Comparing two means is one of the most common situations in statistical practice. WHY? • Types of two-sample problems • We want to compare two populations and have a sample from each. • We want to compare treatment to a control or two different treatments. • Note: A matched pairs design is different in that it compares both treatments for EACH individual. These are not independent.
Knowing the difference • In the following slides, determine whether the situation is one sample, matched pairs, or two samples.
Example 1 • To check a new analytic method, a chemist obtains a reference specimen of known concentration from the National Institute of Standards and Technology. She then makes 20 measurements of the concentration of this specimen with the new method and checks for bias by comparing the mean result with the known concentration. ONE SAMPLE
Example 2 • A psychologist develops a test that measures social insight. He compares the social insight of male college students with that of female college students by giving the test to a sample of students of each gender. TWO SAMPLE
Example 3 • A researcher wants to know if it’s more beneficial to put questions before or after introducing a new topic in a math textbook. She prepares text segments on two unrelated topics. Each segment comes in two versions, one with questions before and the other with questions after. The subjects are a single group of children. Each child studies both topics, one (chosen at random) with questions before and the other with questions after. The researcher compares test scores for each child on the two topics to see which topic he or she learned better. MATCHED PAIRS
Example 4 • A bank wants to know which of two incentive plans will most increase the use of its credit cards. It offers each incentive to two random samples of credit card customers and compares the amount charged during the following six months. TWO SAMPLE
Assumptions for Comparing Two Means • We have two independent SRSs, from two distinct populations. • Both populations are normally distributed.
The t-statistic for two means Remember, it’s always acceptable to refer to a statistic by its name OR by its formula. This is the two-sample t-statistic. This formula is not given on the exam. You can perform the test on the calculator and just name the test in your answer!
Two – Sample Z-Test Just in case you happen to know your population standard deviations for BOTH samples!
Calculating Confidence Intervals for Two-Sample Means Again… Just in case you happen to know the population standard deviations for BOTH samples!
How many degrees of freedom? • This is an EXTREMELY complicated calculation and almost never comes out to whole numbers, which are in your table. • Your calculator will calculate the exact degrees of freedom. You can use a 2-SampTTest, 2-SampZTest, 2-SampZInt, or 2-SampTInt… whichever is appropriate. • We need to talk about “pooled.” For now, choose NO. • You can calculate a conservative degree of freedom: • the smaller of n1 – 1 or n2 – 1.
Example • Does increasing the amount of calcium in our diet reduce blood pressure? A researcher took a random sample of 21 healthy males. The subjects were randomly assigned to two treatment groups. One group of 10 men received a calcium supplement for 12 weeks. The other 11 men received a placebo. The experiment was double-blind. The response variable was the decrease in systolic blood pressure. An increase appears as a negative response.
Homework Chapter 10 #39, 40, 41, 53, 69, 70