Download
1 / 24
240 likes | 340 Views
The State of Our Manufacturing Economy. Chad Wilkerson Vice President, Economist, and Oklahoma City Branch Executive Federal Reserve Bank of Kansas City www.kansascityfed.org/oklahomacity. Oklahoma Conference on Manufacturing October 9 , 2013.

E N D
The State of Our Manufacturing Economy Chad Wilkerson Vice President, Economist, and Oklahoma City Branch Executive Federal Reserve Bank of Kansas City www.kansascityfed.org/oklahomacity Oklahoma Conference on Manufacturing October 9, 2013
The U.S. Economy and Manufacturing
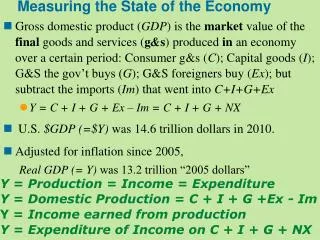
U.S. GDP growth improved in Q2 2013 after slowing earlier with the fiscal cliff Growth in Real GDP Percent change from the previous period, SAAR Source: U.S. Bureau of Economic Analysis, Haver Analytics
But growth in U.S. factory output and jobs slowed through the first half of 2013 U.S. Manufacturing Employment and Output Percent change, year-over-year Percent Source: U.S. Bureau of Labor Statistics
Productivity growth remained moderate, with compensation closely tracking it U.S. Manufacturing Indicators Percent change, year-over-year Percent Source: U.S. Bureau of Labor Statistics
Q3 data suggest U.S. economic growth picked up, including in manufacturing U.S. Private Payroll Employment and Business Indexes Change from previous month, thousands Index Source: Institute for Supply Management, Bureau of Labor Statistics
In its latest projections, the FOMC expected unemployment to continue to improve Unemployment Rate Seasonally Adjusted Percent Sept. FOMC Forecast Ranges in Yellow Long Term Source: U.S. Bureau of Labor Statistics, FOMC
On interest rates, most FOMC participants expect little change until 2015 Federal Funds Rate Year-end target Percent Long Term Sept FOMC Forecast Ranges in Yellow Note – Number of participants who project the initial increase will occur in the specified year in parenthesis Source: U.S. Bureau of Economic Analysis, FOMC
Employment in Oklahoma remains above pre-recession levels, but has eased lately Level of Payroll Employment Through August 2013 Index: Jan-08=100 Oklahoma U.S. Source: U.S. Bureau of Labor Statistics
A drop in energy jobs has hurt the state this year, but manufacturing jobs have held up Employment Growth by Industry August 2013 Percent change year-over-year Source: Bureau of Labor Statistics
And unemployment rates in nearly all of Oklahoma remain better than the U.S. rate County Unemployment Rates July 2013 Source: OK Employment Security Commission
Oklahoma manufacturing exports have risen recently, more than the nation Total Manufacturing Exports Percent change, year-over-year Percent Source: WiserTrade
Aircraft and machinery have driven the rebound in Oklahoma exports this year Manufacturing Exports by Industry (Top 5 Oklahoma export industries) Jul-12 YTD vs. Jul-13 YTD Percent Source: WiserTrade
Oklahoma’s exports to Europe have surged, and exports to China have remained solid Manufacturing Exports by Destination (Top 5 Oklahoma export destinations) Jul-12 YTD vs. Jul-13 YTD Percent Source: WiserTrade
As in the nation, regional manufacturing activity improved in the third quarter Manufacturing Composite Indexes Month-over-month, Seasonally Adjusted Index Source: FRB Kansas City
And expectations among regional plant managers increased in September Tenth Fed District Manufacturing Expectations Six-month ahead, Seasonally Adjusted Index Source: FRB Kansas City
For most of the past decade, Oklahoma factory jobs have grown faster than the U.S. Manufacturing Employment Percent change, year-over-year Percent Source: U.S. Bureau of Labor Statistics
Manufacturing’s share of employment in Oklahoma is now similar to the nation Manufacturing Share of Total Employment Percent Source: U.S. Bureau of Labor Statistics
Nearly all of the net job gains in the state have been in machinery or primary metals Oklahoma Manufacturing Employment by Industry Change in number of jobs, 2002-2012 Source: U.S. Bureau of Labor Statistics
Machinery, metals, petroleum, and mineral manufacturing make the state most unique Share of Manufacturing Output by Industry 2011 Source: U.S. Census Bureau ASM
Summary • U.S. manufacturing slowed in early 2013 as jobs and hours flattened out, but growth has risen since Q2 • Regional and Oklahoma factory activity has also picked up lately, driven in part by stronger exports
Questions and Links • For more information about the Kansas City • Fed’s Monthly Survey of Manufacturers, • please go to our website: • www.kansascityfed.org/research/indicatorsdata/mfg • For more information about the Oklahoma economy,subscribe to the quarterly • Oklahoma Economist at: • www.kansascityfed.org/publications/research/oke