Download
1 / 13
130 likes | 237 Views
Explore GDP measurements, components, and impact on the economy. Find out what's included and what's not in GDP calculations. Learn about nominal vs real GDP and chain-weighted data. Discover the income, production, and expenditure approaches to GDP.

E N D
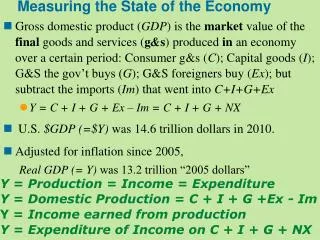
Measuring the State of the Economy • Gross domestic product (GDP) is the market value of the final goods and services (g&s) produced in an economy over a certain period: Consumer g&s (C); Capital goods (I); G&S the gov’t buys (G); G&S foreigners buy (Ex); but subtract the imports (Im) that went into C+I+G+Ex • Y = C + I + G + Ex – Im = C + I + G + NX • U.S. $GDP (=$Y) was 14.6 trillion dollars in 2010. • Adjusted for inflation since 2005, Real GDP (= Y) was 13.2 trillion “2005 dollars” Y = Production = Income = Expenditure Y = Domestic Production = C + I + G +Ex - Im Y = Income earned from production Y = Expenditure of Income on C + I + G + NX
Y = Production = Expenditure = Income • The production measure of GDP counts the goods and services produced in the economy. • Y = C + I + G + Ex – Im • The expenditure measure of GDP counts the total purchases in the economy. • Y = C + I + G + Ex – Im • The income measure of GDP counts all the income earned in the economy from producing Y. • C + I + G + Ex – Im = Y
The Expenditure Approach to GDP • The national income accounting identity states that Y = C + I + G + NX where Y is GDP, C is consumption, I is investment, G is government purchases, and NX is net exports. • Consumption accounted for 70 % of 2005 US GDP; C includes new autos, food, clothing, housing services, medical care, travel, entertainment, etc. • Investment made up 16 % of GDP; I includes business purchases of new plant and equipment, production of new homes that provide housing services over time, and increases in business inventories (working capital). • Government purchases were 19 % of GDP; G includes purchases of goods, e.g., missiles, and services, e.g., teacher services, by federal, state, & local gov’ts. • Transfers are government payments to individuals not associated with any current production (Social Security, Medicare, unemployment insurance) and are not include in GDP because no goods are produced. • C + I + G = 105.8 % of Y = 105.8 % of what the US economy produced • Net exports are exports minus imports; NX were - 5.8 % of GDP. • The US is borrowing goods from the rest of the world. • As the trade balance turned more negative in the early 2000s, consumption increased as a share of GDP.
Composition of GDP, 2005 2010III % 100.0 71.0 Durabl 7.5 NonD 15.8 Service 47.1 12.9 3.3 7.4 2.2 20.5 5.6 -3.1 13.2 16.3 CHAPTER 2Measuring the Macroeconomy
Income Approach to GDP, 2005 NI = National Income = Income earned from production Capital income = Y - (Wages + Benefits) - Indirect business taxes - depreciation NI = Labor income + Capital income = Y - Indirect business taxes - depreciation Labor income ≈ 2/3 of Y CHAPTER 2Measuring the Macroeconomy
The Production Approach to GDP • There is no “double counting” in GDP; only the final sale of goods and services count. • The amount each producer contributes to GDP is called the value added. • Value added is the revenue generated by each producer minus the value of intermediate products. • Only new production of goods and services counts toward GDP. CHAPTER 2Measuring the Macroeconomy
What Is Included in GDP and What’s Not? • Only goods and services that are transacted through markets are included in GDP. • GDP does include expenditures we’d rather not make: • Controlling crime • Defending against enemies • Disposing of waste • GDP does not include a measure of the health of a nation’s people. • GDP does not include changes in environmental resources. • GDP does not include household production. • GDP does not include the value of leisure. • GDP does not include illegal or underground activities. CHAPTER 2Measuring the Macroeconomy
Nominal GDP is measured in current dollars while Real GDP is measured in constant year dollars, e.g., Year 2009 dollars or Year 2010 dollars. • If the quantity of goods and services produced does not change, but prices do change, then nominal GDP will change though nothing really changes. • In an economy with multiple goods, we must use one year’s prices to compute real GDP across time. • The magnitude of the change in real GDP will depend on the year’s prices we select to calculate real GDP. • Chain weighting is preferred because new goods are invented while others become obsolete – rending prices relatively high or low on such goods in the initial or final years. CHAPTER 2Measuring the Macroeconomy
Using Chain-Weighted Data • The sum of real chain-weighted consumption, investment, government purchases and net exports will not equal real chain-weighted GDP because the prices used in constructing the different components are different. • When interested in the shares of particular components of GDP, look at the ratio of nominal variables. • When interested in real rates of economic growth, use the chain-weighted real measures. CHAPTER 2Measuring the Macroeconomy
Price Indexes and Inflation • The GDP deflator is the price level that satisfies the equation: nominal GDP = price level * real GDP. • The percentage change in nominal GDP is approximately equal to the percentage change in the price level plus the percentage change in real GDP. • The inflation rate is the percentage change in the price level. CHAPTER 2Measuring the Macroeconomy
Comparing Economic Performance across Countries • The exchange rate is the price at which different currencies are traded. • To make comparisons of GDP across countries we must take the following two steps: • GDP must first be adjusted by the exchange rate – so that GDP is expressed in a common currency, usually the U.S. dollar. • Second, once in a common currency, this value of nominal GDP must be multiplied by the ratio of prices in the countries. • The result is each country’s GDP in Purchasing Power Parity dollars. • In general, rich countries tend to have higher price levels than poor countries. • This is mainly because poor countries are less productive in their export and import competing industries and therefore have lower wages in all industries. CHAPTER 2Measuring the Macroeconomy