Download
1 / 35
350 likes | 426 Views
Learn about Strategic Asset Management, asset allocation, and diversification strategies to enhance client returns and minimize market risks. Understand the importance of portfolio diversification and allocation decisions in achieving long-term financial goals.

E N D
IAR - Read this first! This presentation is for advisory clients and prospects only. You must be a Investment Advisor Representative (IAR) to use this presentation with clients/prospects. All slides and speaker note scripts must be used in the format provided and cannot be altered. Slides may not be provided in any form to clients and/or prospects. Any modifications to this presentation must be submitted to LPL Financial Advertising Review for approval prior to first use. Speaker notes are accessed by going to View > Notes Page. Microsoft PowerPoint (not Viewer) required to see Notes Pages.
S T R A T E G I C A S S E T M A N A G E M E N T (SAM) A TIME-TESTED INVESTMENT STRATEGY The LPL Financial family of affiliated companies includes LPL Financial, UVEST Financial Services Group, Inc., IFMG Securities, Inc., Mutual Service Corporation, Waterstone Financial Group, Inc., and Associated Securities Corp., each of which is a member of FINRA/SIPC.
Strategic Asset Management • Asset Allocation and Diversification • My Role as an Advisor • The Consulting Process • My Advisory Platform • Strategic Asset Management There is no guarantee that a diversified portfolio will enhance overall returns or outperform a non-diversified portfolio. Diversification does not ensure against market risk.
Strategic Asset Allocation Divide your portions between seven or eight for you do not know what misfortune will come to this world.
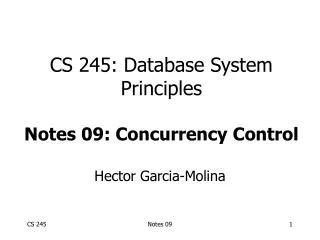
Asset Allocation Drives Performance Market Timing 1.8% Other Factors 2.1% Security Selection 4.6% Asset Allocation Decision 91.5% Source: “Determinants of Portfolio Performance II: An Update” - Brinson, Singer, & Beebower, Financial Analysts Journal, May / June 1991
How Many Baskets Do You Have? BestPerforming WorstPerforming Sources Bonds: LB Aggregate Bond Index L Growth: Russell 1000 Growth Index L Value: Russell 1000 Value Index S Growth: Russell 2000 Growth Index S Value: Russell 2000 Value Index Intl: MSCI EAFE Index HFRI: HFRI Equity Hedge Index Indices are unmanaged and cannot be invested into directly. See attached page for disclosures.
How Many Baskets Do You Have? Disclosure: Treasury bills are backed by the full faith and credit of the United States Government. Please note that the value of bonds generally have an inverse relationship to interest rates. Stocks will experience market fluctuations which can include loss of principal value while bonds offer a fixed-rate of return. Small-cap stocks may be subject to a higher degree of market risk than large-cap stocks, and the illiquidity of the small-cap market may adversely affect the value of these investments so that when redeemed, shares may be worth more or less than their original cost. High-yield securities inherently have a higher degree of market risk and there are credit risks associated with the underlying issuers. In addition, lack of liquidity associated with high-yield securities may impair their value. International and emerging market securities are also subject to additional risks such as currency fluctuations and political instability. Prior to investing in any security, consult with your financial professional.
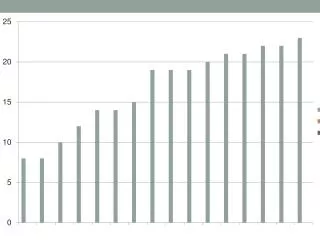
A Tale of Three Investors Our first investor, Peter, employs an investing strategy known as “chasing performance.” He invests a hypothetical $10,000 at the end of each year into the best-performing market segment of that year and continues this process for twenty years. For purposes of this comparison, the overall market has been divided into six separate indices – Lehman Agg. Bond Index, M.S. Capital International, Russell 1000, Russell 1000 Growth, Russell 1000 Value and Russell 2500. It is not possible to invest directly in an index. Beginning 12/31/82 and ending 12/31/02, “Peter” invests $10,000 on January 1 of each year for twenty years into the best-performing market segment of the previous year. The money is left in the specific sector for the duration. This is a hypothetical illustration and not representative of any specific investment. Your situation will vary. Past performance is no guarantee of future results.
A Tale of Three Investors Our second investor, Rhoda, is always hoping for the “rebound.” She invests at the end of each year in the worst performing segment of that year and continues this process for twenty years. For purposes of this comparison, the overall market has been divided into six separate indices – Lehman Agg. Bond Index, M.S. Capital International, Russell 1000, Russell 1000 Growth, Russell 1000 Value and Russell 2500. It is not possible to invest directly in an index. Beginning 12/31/82 and ending 12/31/02, “Rhoda” invests $10,000 on January 1 of each year for twenty years into the worst-performing market segment of the previous year. The money is left in the specific sector for the duration. This is a hypothetical illustration and not representative of any specific investment. Your situation will vary. Past performance is no guarantee of future results
A Tale of Three Investors Irvin is the insightful investor. He allocates and diversifies his $10,000 by investing equally in six different market segments each year for 20 years. And not only does Irvin allocate and diversify, but at the end of every quarter, his portfolio’s assets are rebalanced so that they are equally distributed among six segments. For purposes of this comparison, the overall market has been divided into six separate indices – Lehman Agg. Bond Index, M.S. Capital International, Russell 1000, Russell 1000 Growth, Russell 1000 Value and Russell 2500. It is not possible to invest directly in an index. “Irvin” follows this process from 12/31/82 – 12/31/02, investing an addiional $10,000 every January 1. This is a hypothetical illustration and not representative of any specific investment. Your situation will vary. Past performance is no guarantee of future results.
A Tale of Three Investors Maintaining a well-diversified portfolio worked Irvin may be onto something. His strategy combining asset allocation and rebalancing significantly outperformed the other two approaches. Peter Rhoda Irvin This is a hypothetical illustration designed to demonstrate the effects of diversification and rebalancing and is not intended to project performance. No strategy assures success or protects against loss. Past performance is no guarantee of future results. The Lehman Brothers Agg. Bond Index is a measure of the U.S. bond market. The MSCI EAFE Index is a measure of the international stock market. The Russell 1000 Index measures the performance of large-cap U.S. stocks. The Russell 1000 Growth Index measures the performance of large-cap U. S. growth stocks. The Russell 1000 Value Index measures the performance of large-cap U.S. value stocks. The Russell 2500 Index measures the performance of U.S. small-cap stocks
Investor A: Invests $100,000 Chases Returns Goes up 30% one year, down 10% the next. Continues this pattern for 20 years. Investor B: Invests $100,000 Disciplined, Diversified Portfolio Goes up 10% one year, up 10% the next. Continues this pattern for 20 years. Consistency, Consistency, Consistency Average Annual Return, Investor A: 10% Average Annual Return, Investor B: 10% Account Value after 20 years: $480,674 Account Value after 20 years: $672,735 This is a hypothetical illustration. Your results will vary.Diversification is an investment strategy that seeks to reduce risk an provide competitive returns. No investment strategy guarantees against a loss. The hypothetical rates of return do not reflect the cost inherent in investing.
AppreciationFund Many Assets, Little Diversification • Large Company Growth Stocks Stock investing involves risk, including loss of principal.
Don’t Be That Guy! Stuart and Mr. P “Catch the wave of the future, m’man!” Source: Ameritrade
My Role as Advisor:Quiet the Noise and Remain Disciplined Determine Objectives On-Going Review Asset Allocation You Security Selection
Step 2: Build Asset Allocation Framework Growth with Income
Small Cap U.S. Growth Small Cap U.S. Value Small Cap/Emerging Market Large Cap U.S. Growth Large Cap U.S. Value Large Cap Foreign Int/LT Hi-Quality Bond Int/LT High Yield Bond Int/LT Foreign Bond Cash Large Cap U.S.Growth Growth Fund of America Columbia Marsico Growth Harbor Capital Appreciation IXIS Advisor Funds T Rowe Price Growth Stock Fund Step 3: Select Underlying Investments Investors should consider the investment objectives, risks, charges and expenses of the investment company carefully before investing. The prospectus contains this and other information about the investment company. You can obtain a prospectus from your financial representative. Read carefully before investing.
The Fund Selection Process • Management Team • Investment Philosophy • Risk • Expenses • Adherence to Style Investing in mutual finds involves risk, including loss of principal. Investments in specialized industry sectors have additional risks, which are outlined in the prospectus.
Step 4: Ongoing Portfolio Review • Discuss Account Performance • Revisit Client Objectives • Review Asset Allocation • Explain Rebalancing • Implement Decisions
Staying in Balance • Source: LPL Financial. Values represent the total return of unmanaged indices assuming full reinvestment of capital gains and dividends. Equity allocation represented by the Russell 3000 Index; Bonds represented by the Lehman Brothers Aggregate Bond Index; Cash represented by the Lehman Brothers 3-month T-Bill. Past performance is no guarantee of future results. Indices may not be invested into directly. No strategy assures success or protects against loss. This hypothetical example is intended to demonstrate the effects of rebalancing and is not intended to project performance.
My Advisory Process: By building a relationship based on advice, rather than transactions, my success is directly linked to that of my client.
Benefits of Strategic Asset Management • Multiple Investment Choices • Flexibility • World Class, Unbiased Research • One Account, One Statement, One Fee
Multiple Investment Choices 6,250+ No-load /Load Waived Mutual Funds* Individual Stocks & Bonds** No-Load Variable Annuity Previously Purchased Investments • Certain funds in SAM pay 12b-1 fees. Nominal transaction charges apply. ** Stock investing involves risk, including loss of principal. Bonds are subject to market and interest rate risk if sold prior to maturity. Bond values will decline as interest rates rise and are subject to availability and change in price.
AIM Allianz American Funds Dreyfus Fidelity Franklin/Templeton Janus MFS Neuberger/Berman Sample Fund Families • Oppenheimer • PIMCO • Putnam • RS Funds • Scudder • TCW • Transamerica • T Rowe Price • Vanguard Investors should consider the investment objectives, risks, charges and expenses of the investment company carefully before investing. The prospectus contains this and other information about the investment company. You can obtain a prospectus from your financial representative. Read carefully before investing.
Flexibility • Change Asset Allocation as Your Objectives Change • Aligned Interest • Trade Without Paying Commissions* * Certain funds in SAM pay 12-b1 fees. Nominal transaction charges occur.
LPL Financial World Class Research • One of the Largest Independent Investment Research Organizations • Analysts Covering Individual Securities and Mutual Funds • No Investment Banking, No Proprietary Products
LPL Financial Resources LPL Financial Research
One Account, One Statement, One Fee • Consolidated, Quarterly Report • Consolidated Tax Statement • Predictable Expenses Linked to Portfolio Performance
The End Result • Consistent, Risk-Adjusted Investment Returns Ongoing Review Security Selection Asset Allocation Determine Objectives
Strategic Asset ManagementA Time-Tested Investment Strategy “The only thing new in this world is the history you don’t know.”-Harry S. Truman
Your Next Step Schedule a meeting for a more in depth look at my practice and receive a complimentary investment analysis.