Download
1 / 10
120 likes | 309 Views
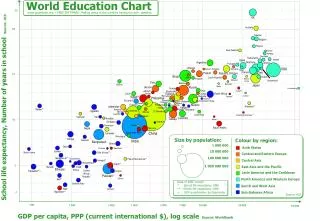
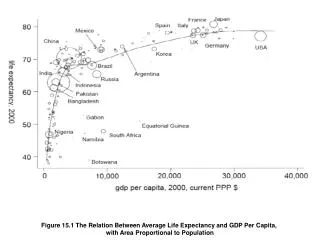
Figure 15.1 The Relation Between Average Life Expectancy and GDP Per Capita, with Area Proportional to Population. Figure 15.1. Range of Predictions of Global Average Temperature Increase over Pre-Industrial Levels, 2000-2100.

E N D
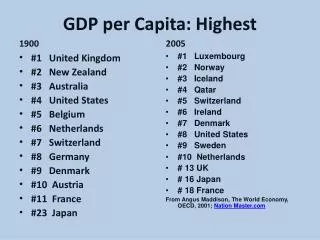
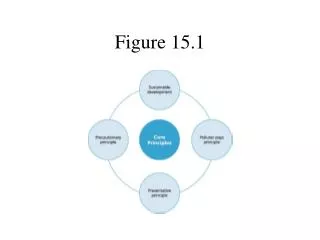
Figure 15.1 The Relation Between Average Life Expectancy and GDP Per Capita, with Area Proportional to Population
Figure 15.1. Range of Predictions of Global Average Temperature Increase over Pre-Industrial Levels, 2000-2100.
Figure 15.3. Environmental Kuznets Curve for Sulfur Dioxide Emissions
Figure 15.4 Carbon Dioxide Emissions vs. GDP per Capita, 2002[1]
Figure 15.5 Environmentally-Based Taxes as a Share of Total Tax Revenue, Selected Developed Countries
Table 15.1. Global Population Classification by Income and Environmental Impacts, 2005
Figure 1 Population by Age and Sex, United States, 1900, 2000, and 2040 (projected) (to be continued)
(continued) Figure 1 Population by Age and Sex, United States, 1900, 2000, and 2040 (projected)