Download
1 / 26
260 likes | 382 Views
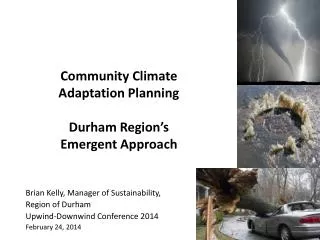
Community Climate Adaptation Planning Durham Region’s Emergent Approach. Brian Kelly, M anager of Sustainability, Region of Durham Upwind-Downwind Conference 2014 February 24, 2014. Outline. Background and Context. CCAP Process Climate Projections by SENES Consultants

E N D
Community Climate Adaptation PlanningDurham Region’s Emergent Approach Brian Kelly, Manager of Sustainability, Region of Durham Upwind-Downwind Conference 2014 February 24, 2014
Outline • Background and Context. • CCAP Process • Climate Projections by SENES Consultants • An Emergent Process • Next steps Objectives: • To outline Durham Region’s emerging approach to Community Climate Adaptation planning • To contrast our approach to that of others • To offer learnings from our experiences to date
DRRCC Mandate DRRCC Goal: • “To position the Region of Durham as a leader in addressing climate change issues by preparing and recommending a comprehensive strategy with detailed actions that can be undertaken across the Region to address climate change.” DRRCC Mandate: • “ outreach/advocacy: encouraging [stakeholders]to address climate change in their respective practices and operations” Adaptation Sub-Committee mandate is to identify: • projected future climate & weather conditions; • key vulnerabilities, impacts & management strategies to safeguard infrastructure; • economic impacts (and opportunities); • how a more resilient region can attract new business.
Background: LAP Phase 1 Report Vision: “Durham Region is a carbon neutral, sustainable, prosperous and resilient community witha high quality of life.” Community Targets: 5% reduction in GHG emissions by 2015 20% reduction in GHG emissions by 2020 80% reduction in GHG emissions by 2050 (absolute targets, measured against 2007 baseline emissions) Developed during 2010 based on stakeholder input over summer Adopted by Regional Council on March 9, 2011
Phase 2 Progress Report Resulted from Design Charette Progress Report released July 29/11 Identified 23 Action Plan Concepts (APCs) Stakeholder and public review for 60 days Consolidated to 17 APCs + an 18th education APC Presentations to business stakeholders over fall of 2011 Early approval of Durham Partners in Project Green (DPPG) – Dec. 14/11
Community Local Action Plan Rationale for Local Action Context and Background: Emissions Inventory Vision Mission Targets Process 18 Potential Programs (one approved to date) Impacts and Co-Benefits Implementation Strategies Adaptation Next Steps
Potential Programs in the LAP Durham Partners in Project Green* Comprehensive Residential Retrofit Green Affordable Housing Durham Green Building Guideline Smart Grid Initiative* Offshore Wind Power Generation Durham Mini-Deep Lake Water Cooling Durham Biofuels Program Bio-Methane Production and Use Local Food Hub Urban Agriculture Program Farm-Friendly Regulations Durham Five Million Trees Active Transportation and Transit* Durham Freecycle Program Durham Green Procurement Guideline Community Climate Fund Climate Education Program
DO THE MATH • 2°C : The maximum global rise in average temperature that still gives us a 50% probability of avoiding climate destabilization Pre-industrial base: 280 ppm ofCO2 Now: +0.8°C = 396 ppmBy 2030: +2°C = 450 ppm … 16 years leftBy2100: +4-6°C = 750-1,200 ppm • 565 gigatons: CO2 we can add before we reach 450 ppm. • 2,795 gigatons: CO2 in proven fossil fuel reserves. 5 X what we can add Therefore 80% of the proven reserves must stay in the ground; “stranded asset” risk for fossil fuel companies. 350.org http://math.350.org/
What is Climate Adaptation? • Climate mitigation is protecting nature from us; climate adaptation is protecting us from nature. • The goal of adaptation is to prepare, protect and safeguard us and our infrastructure. • Some adaptation measures can be both adaptation and mitigation (e.g. tree planting, white roofs, green roofs). • No cynicism allowed (as in: “Well, I won’t be around for that…..”)
Adaptation Planning Process Options: 1. Follow the ICLEI Process 2. Follow the Toronto process (e.g. WeatherWise Partnership) 3. Develop a hybrid process for Durham Our motto: “Imitation is the highest form of flattery.”
CCAP Process • Future Climate Parameters (SENES Study) : What are the climate conditions we are planning for? • Stakeholder Engagement: Who are the key stakeholders and what are their initial thoughts? • Expert Task Forces (Feb, March & April): What are the vulnerabilities, risks and responsive actions? • Design Charette(May): How do the various streams integrate into one plan with proposed programs? • Proposed CCAP (DRRCC, Sept. 12) • Recommended CCAP (Regional Council, Oct. 8/14) What is the plan and the proposed programs?
Future Climate Projections SENES Consultants was commissioned to project future climate and extremesfor Durham region (based on extensive study done for Toronto in 2011) Remember our motto: “Imitation is the highest form of flattery.” Basis for confidence in projections include: • The model is based on established scientific principals. • Model is able to reproduce observed changes in climate. • The model resolution is very high (1 km x 1 km cells). • The model projects both averages and extremes.
Projections Model (SENES) Report of climate and extreme weather projections for timeframe 2040-2049 compared to 2000-2009. • Model provides projections not predictions (consistent with IPCC) – because it is not possible to know what future emissions of GHG will actually be. • Model based on IPCC emissions scenario A1B. The scope of the SENES study is: • all eight local municipalities in the Region of Durham:Ajax,Brock (Beaverton), Clarington (Bowmanville), Oshawa, Pickering, Scugog(Port Perry), Uxbridge (Town of Uxbridge), Whitby • parameters of temperature & precipitation with surrogates for lightning and combined parameters for tornadoes. • both climate means and weather extremes were included.
Future Period: 2040-2049 Compared to 2000-2009 The following summarizes the projected climate changes for the proxy Whitby site for the future period compared with the base period: Less snow and more rain in winter - about 16% more precipitation (snow and rainfall) overall. • 50% increase in one day maximum rainfall • 40% decline in one day maximum snow • 100% increase in number of days of rain greater than 25 mm • 80% reduction in the number of days with snow more than 5 cm • 146% more rain and 61% less snow in January • 217% more rain and 75% less snow in February Rainstorm events will be more extreme • 15% increase in the potential for violent storms • 53% increase in the potential for tornadoes • 74% more rain in July • 79% more rain in August
Temperature Changes - Whitby • average annual temperatures increase of 4.0oC • average winter temperatures increase by 5.8oC • average summer temperatures increase by 2.6oC • extreme daily minimum temperature "becomes less cold" by 12oC • extreme daily maximum temperature "becomes warmer" by 7.1oC
Heat & Humidity – Duration and Frequency • Higher temperatures in summer (2000 - 2009 to 2040 -2049) • tmax >30°C: 3 days/year to 16.8 days/year, greatest increase Uxbridge, Port Perry and Beaverton 4.8 days to 25.8 days) • T max >35°C: 0 days/year to 1-4 days/year • Tmax > 40°C: 0 days/year, to 0.14 days/year • More frequent heat waves (2000-2009 to 2040-2049) • > 30°C more than 2 days : 0.025 events/year to 3.9 events/year (greatest increase in Uxbridge, Port Perry and Beaverton of average 7.5 events/year) • > 40°C more than 2 days : 0 events/year 2000-2009 to 0.1 events/year 2040-2049 (Uxbridge only 0.1 average) • Humidex • > than 40°C eq. (great discomfort) projected increase from 3 to 17 events/year. • greater than ‘dangerous’ level (45°C eq.) -0 to 3.2 events/year (greatest potential being in Uxbridge, Port Perry, Beaverton).
High Level Summary of Climate Projections Precipitation • Less snow and more rain. • Rain storm events more frequent and severe (Whitby 15% increase in potential for violent storms). • Increase number of days of heavy rain (>50mm in 6 hours with temp > 1°C) from 1.5 events/year 2000-2009 to 5.3 events/year 2040-2049 (with the greatest increase occurring in Port Perry 0.9 /year to 9 /year). • Ice storms not frequent today and in 2040-49 projected to drop to almost zero. • Projected 45% increase in days with high potential for lightning - across Durham.
High Level Summary of Climate Projections - Tornadoes • Increased potential for tornadoes • 53% increase in Whitby (days/10 years) – EHI >=1; 150 to 172 days; EHI >=2; 37 to 54 days, EHI >=3; 9 to 16 days; EHI >=4; 3 to 5 days; EHI >=5; 0 to 4 days) • 23% increase across Durham – Uxbridge, Port Perry, and Beaverton continuing to be most susceptible • EHI of 1 represents supercell potential; 1-5 represents F2/F3 potential, EHI of 5+ represents F4/5 potential (Goderichwas an F3);
Stakeholder Meetings to Date • All municipalities (with exception of Brock Township) • All five Conservation Authorities • Chambers of Commerce and Boards of Trade • Electrical distribution utilities • Others • To come: DEAC, DAAC, local councils
Expert Task Forces Proposed Task Forces Proposed Schedule Joint kickoff meeting – Feb. 21 Task Forces to meet March, April & May Design Charette – Late May • Flooding • Heat Events • Electricity Supply • Transportation/Roads • Natural Environment* • Buildings* • Telecom (on hold) • Food Supply (on hold)
The Durham Differences • Community plan in a 2-tier regional municipality • Compressed schedule (1 year) • Started with Climate Projections (SENES study) • Then engaged stakeholders using projections • Create Expert Task Forces among stakeholders • Ask stakeholders to identify the implications and possible responses • Integrate Task Force streams in a Design Charette • Take a “plan” to this Council Watch this space!