
Multiwavelength Study of Starburst Phenomena in the Dwarf Galaxy NGC 625
This study presents a comprehensive analysis of NGC 625, a low-mass dwarf starburst galaxy. Using data from Chandra, FUSE, HST, CTIO, ATCA, and VLA, we investigate its stellar population and multi-phase interstellar medium (ISM). Key findings reveal distinct Wolf-Rayet features indicating brief starburst events, a prolonged star formation history spanning over 50 million years, significant kinetic energy input from star formation, and complex kinematics consistent with a large gas outflow. The results offer insights into the evolution of low-mass galaxies and their ISM dynamics.

Multiwavelength Study of Starburst Phenomena in the Dwarf Galaxy NGC 625
E N D
Presentation Transcript
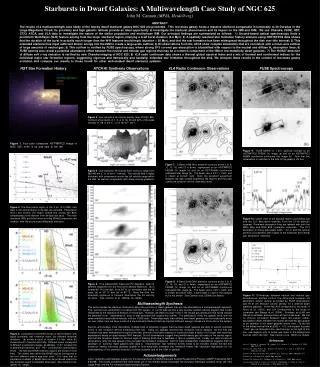
ABSTRACT The results of a multiwavelength case study of the nearby dwarf starburst galaxy NGC 625 are presented. This low-mass galaxy hosts a massive starburst comparable in luminosity to 30 Doradus in the Large Magellanic Cloud; its proximity and high galactic latitude provide an ideal opportunity to investigate the starburst phenomenon and its impact on the ISM and IGM. We use Chandra, FUSE, HST, CTIO, ATCA, and VLA data to investigate the nature of the stellar population and multi-phase ISM. Our principal findings are summarized as follows: 1) Ground-based optical spectroscopy finds a prominent Wolf-Rayet (W-R) feature arising from the major starburst region, implying a brief burst duration (4-6 Myr); 2) A spatially resolved star formation history analysis using HST/WFPC2 data shows that the duration of the burst is actually much longer than the W-R features would imply (duration > 50 Myr), and that the star formation has been widespread throughout the disk over this interval; 3) This extended starburst has input sufficient kinetic energy into the ISM to create a large-scale outflow; 4) HI observations from the ATCA show complex kinematics that are consistent with a minor-axis outflow of large amounts of neutral gas; 5) This outflow is verified by FUSE spectroscopy, where strong OVI coronal gas absorption is blueshifted with respect to the neutral and diffuse H2 absorption lines; 6) FUSE spectra also reveal a potential abundance offset between the neutral and nebular gas regions that may be a common component of the ISM of low-metallicity dwarf galaxies; 7) The ROSAT detection of diffuse soft x-ray emission is verified by new Chandra imaging of NGC 625; 8) VLA radio continuum data shows a thermal global spectral index and a mix of thermal and nonthermal indices for the individual major star formation regions, suggesting vigorous and (temporally and spatially) extended star formation throughout the disk. We interpret these results in the context of low-mass galaxy evolution and compare our results to those found for other well-studied dwarf starburst systems. …………………………………………………………………………………………………………………………… Starbursts in Dwarf Galaxies: A Multiwavelength Case Study of NGC 625John M. Cannon (MPIA, Heidelberg) HST Star Formation History. ATCA HI Synthesis Observations VLA Radio Continuum Observations FUSE Spectroscopy Figure 4. Low-resolution HI column density map of NGC 625. Contours show levels of 1, 2, 4, 8, 16, 32 and 64% of the peak intensity (1178 K km s-1, or 2.15x1021 cm-2). ………………… Figure 1. Four-color composite HST/WFPC2 image of NGC 625; north is up and east to the left. ………… Figure 9. FUSE MDRS (4˝ x 20˝) aperture overlaid on an HST/WFPC2 F555W (V) image (a) and on an HST/WFPC2 F656N (continuum subtracted Hα) image (b). Note that this observation is sensitive to the bulk of the galaxy’s UV flux. …… Figure 7.C-Band (4.86 GHz) emission contours at the 3, 6, 9, 12, 15, 18, and 21 σlevels, superposed on an HST/WFPC2 F555W (V) image (a) and on an HST/F656N (continuum subtracted Hα) image (b). The beam size is 5.31˝ x 3.63˝, and is shown at bottom right. Note the excellent agreement between the high surface brightness HII regions and the radio continuum emission at this sensitivity level. …………………… Figure 5. Low-resolution HI velocity field; contours range from 380-440 km s-1 in 10 km s-1 intervals. The velocity field is highly disturbed, with components across the full velocity range within the disk, as well as components with steep velocity gradients. ……………………………………………… Figure 2. The blue plume region of the V vs. (V-I) CMD; only stars in the central region of the disk are included. Photometric errors are shown; the heavy dotted line shows the 80% completeness level derived from artificial star tests. The main sequence (MS) and blue helium burning (BHeB) sequences are overlaid; note the pronounced differential extinction. ………….. Figure 10.Closer view of the spectral region surrounding Ly and the OVI absorption features, from the LiF1A detector segment. Prominent absorption lines are labeled with both the Milky Way and NGC 625 (systemic) velocities. The OVI absorption is strong (equivalent width ~ 0.2 Å) and the velocity centroid is blueshifted with respect to the molecular and neutral gas absorption centroids. ………………………………………… Figure 8. X-Band (8.46 GHz) emission contours at the 3, 6, 9, 12, 15, 18, and 21 σlevels, superposed on an HST/WFPC2 F555W (V) image (a) and on an HST/F656N (continuum subtracted Hα) image (b). The beam size is 4.45˝ x 3.63˝, and is shown at bottom right. L-band data is used in the analysis but is not shown. See Cannon et al. (2004b) for details. ……… Figure 6. Five independent major-axis PV diagrams, taken at different distances from the HI column density maximum. (a) is located 60˝ N of the disk, (b) at 30˝ N, (c) coincident with the HI peak, (d) at 30˝ S, and (e) at 60˝ S. Near the disk, the kinematic signature of blowout dominates the HI velocity structure. See Cannon et al. (2004a) for details. ………… Figure 11. Differences between neutral and nebular gas abundances plotted versus the difference between HI absorption column density as probed by FUSE observations and HI 21 cm emission column density, for 4 different dwarf starburst galaxies. In the key, A03 corresponds to the study of Aloisi et al. (2003), and L04 corresponds to the study of Lecavelier des Etangs et al. (2004). Errorbars on Δ(HI) are difficult to estimate, and are shown at the 0.3 dex level. We find no obvious correlation between these two values; rather, abundance offsets between the neutral and nebular gas appear to be common in the dwarf galaxies shown here. To the left of the dotted vertical line at Δ(HI) = -0.3, one expects to probe ``halo'' gas via absorption line spectroscopy; to the right of this line, one expects only to probe gas close to the background sources within the disk. See Cannon et al. (2005) for details. Multiwavelength Synthesis This work provides far-reaching conclusions about the evolution of dwarf galaxies that are only attainable by a multiwavelength approach. First, we have two verifications of outflow from this system. In our HI data we find a very peculiar position-velocity diagram that is best interpreted as the signature of blowout of neutral gas. However, we detect no clear holes in the neutral gas distribution that would indicate the presence of an ``instantaneous'' burst of star formation that caused this outflow. It is gratifying to verify this galactic wind, with the same orientation and relative velocity, with our FUSE data. These data imply that outflows from dwarf galaxies are not necessarily exotic nor rare; rather, here we have a case of a low-luminosity starburst that has injected sufficient energy to break out of the disk of the system. Second, and perhaps more importantly, multiple lines of evidence suggest that low-mass dwarf galaxies are able to sustain extended bursts of star formation without exhausting their fuel. Using our spatially resolved star formation history analysis, we find that star formation has been widespread throughout the disk, and that it has been ongoing for a period at least a factor of 10 longer than canonical expectations based on spectroscopic W-R features. Our HI observations suggest that plentiful dense gas still exists in the central region, and that star formation shows no obvious signs of slowing down due to feedback or lack of available fuel. Finally, our radio continuum observations verify the age spread of the youngest star formation complexes. Each of these independent investigations suggests that the paradigm of ``bursting'' dwarf galaxies with rapid or ``instantaneous'' star formation events needs to be revisited. Indeed, the fact that numerous nearby low-mass galaxies appear to host temporally extended star formation events has important implications for our understanding of the chemical evolution of these systems and of the IGM in general. ……………………………………………………. Figure 3. Comparison of synthetic bursts of star formation, with equal (constant) star formation rates, but different temporal durations. (a) shows a burst of duration 5.0 Myr, while (b) shows a burst of duration 50.0 Myr. Different colors correspond to different evolutionary stages, as labeled; ``D.E.'' corresponds to differential extinction, and ``P.E.'' corresponds to photometric errors. The MS and BHeB selection regions are shown in bold lines. The dotted lines within the BHeB regions correspond to the four different coarse age bins used. It is clear that no substantial numbers of BHeB stars can be produced unless the star formation event is extended temporally. See Cannon et al. (2003) for details. ………………………………………………… References Aloisi, A., Savaglio, S., Heckman, T.M., Hoopes, C.G., Leitherer, C., & Sembach, K.R. 2003, ApJ, 595, 760 Cannon, J.M., Dohm-Palmer, R.C., Skillman, E.D., Bomans, D.J., Côté, S., & Miller, B.W. 2003, AJ, 126, 2806 Cannon, J.M., McClure-Griffiths, N.M., Skillman, E.D., & Côté, S. 2004a, ApJ, 607, 274 Cannon, J.M., & Skillman, E.D. 2004b, ApJ, 608, 768 Cannon, J.M., Skillman, E.D., Sembach, K.R., & Bomans, D.J. 2005, ApJ, in press Lecavelier des Etangs, A., Désert, J.M., Kunth, D., Vidal-Madjar, A., Callejo, G., Ferlet, R., Hébrard, G., & Lebouteiller, V. 2004, A&A, 413, 131 Acknowledgements J.M.C. gratefully acknowledges support for this doctoral thesis by NASA Graduate Student Researchers Program (GSRP) Fellowship NGT 5-50346. The results presented here have made use of the Hubble Space Telescope, the Australia Telescope Compact Array, the Very Large Array, and the Far Ultraviolet Spectroscopic Explorer. …………………………………………………………………………………………


