Download
1 / 21
210 likes | 318 Views
Monitoring Vegetation Regeneration after Wildfire. Jess Clark USFS Remote Sensing Applications Center In cooperation with: Marc Stamer ( San Bernardino NF ), Kevin Cooper ( Los Padres NF ), Carolyn Napper ( San Dimas T&D ), Terri Hogue ( UCLA ). Need for Post-fire Monitoring.

E N D
Monitoring Vegetation Regeneration after Wildfire Jess Clark USFS Remote Sensing Applications Center In cooperation with: Marc Stamer (San Bernardino NF), Kevin Cooper (Los Padres NF), Carolyn Napper (San Dimas T&D), Terri Hogue (UCLA) USDA Forest Service, Remote Sensing Applications Center, FSWeb: http://fsweb.rsac.fs.fed.us WWW: http://www.fs.fed.us/eng/rsac/
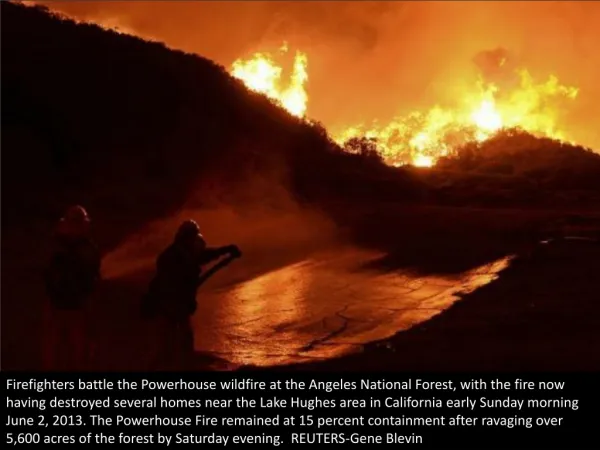
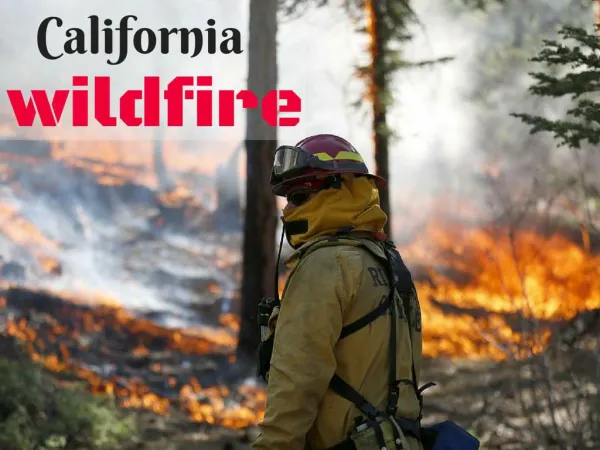
Need for Post-fire Monitoring • Wildfire Effects • BAER Assessments and Treatments • Monitoring Requirements • Who, how often, for how long, who pays? • Values at Risk Photo credit: Robert Leeper USDA Forest Service, Remote Sensing Applications Center, http://fsweb.rsac.fs.fed.us
Role of Remote Sensing • Severity mapping (NBR / dNBR) • Monitoring (NDVI / EVI) • Predictive Modeling (Regression) • Decision Support Tools USDA Forest Service, Remote Sensing Applications Center, http://fsweb.rsac.fs.fed.us
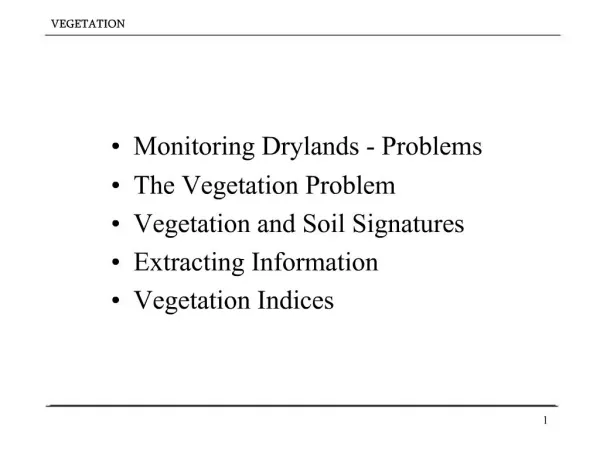
Role of Remote Sensing • Vegetation Indices • NDVI, EVI, NBR USDA Forest Service, Remote Sensing Applications Center, http://fsweb.rsac.fs.fed.us
Severity Mapping • Snapshot in time (NBR / dNBR) • e.g., BAER, RAVG, MTBS • Classes / protocols well defined USDA Forest Service, Remote Sensing Applications Center, http://fsweb.rsac.fs.fed.us
Monitoring • NDVI / EVI for monitoring over time • Trends Analysis • Current compared to pre-fire condition USDA Forest Service, Remote Sensing Applications Center, http://fsweb.rsac.fs.fed.us
Monitoring • NDVI / EVI for monitoring over time • Hybrid Static Cover Layer • Pixel values represent actual cover values USDA Forest Service, Remote Sensing Applications Center, http://fsweb.rsac.fs.fed.us
Project Objectives • Assess effectiveness of remote sensing to monitor vegetation regeneration • Methods: • Field data collection • Remote sensing based observations • Correlation analysis / predictive modeling • Application USDA Forest Service, Remote Sensing Applications Center, http://fsweb.rsac.fs.fed.us
Locations • Six fires: Old (2003), Am. River Complex (2008), La Brea (2009), Station (2009), Bull (2010), Canyon (2010) Am. River Complex Bull / Canyon La Brea Station Old USDA Forest Service, Remote Sensing Applications Center, http://fsweb.rsac.fs.fed.us
Methods – Field Data Collection • Pole-mast photography • “Plot” = area of homogeneous ground condition • Between 4 and 10 photos per plot • Photos interpreted later USDA Forest Service, Remote Sensing Applications Center, http://fsweb.rsac.fs.fed.us
Methods – Photo Interpretation • Pole-mast photography • Each photo interpreted cover vs. no-cover • Stats summarized by plot (4 to 10 photos) USDA Forest Service, Remote Sensing Applications Center, http://fsweb.rsac.fs.fed.us
Methods – Satellite Imagery • Imagery collected pre- and post-fire • NDVI / EVI creation • Pixel values summarized by plot areas USDA Forest Service, Remote Sensing Applications Center, http://fsweb.rsac.fs.fed.us
Results • NDVI and EVI both showed relatively high correlation to ground cover • Leads to application of thresholds for thematic output % Ground Cover % Ground Cover EVI Value NDVI Value USDA Forest Service, Remote Sensing Applications Center, http://fsweb.rsac.fs.fed.us
Discussion and Limitations • Less than perfect field data collection • Clumping of fires, not values • Some historic (recovered) fires and some current (still black) fires • Muddy results in critical data range • Poor linear function in the 0.2 – 0.35 NDVI data range USDA Forest Service, Remote Sensing Applications Center, http://fsweb.rsac.fs.fed.us
Application for New Fires • Time series imagery for new fires • Horseshoe 2, Monument, Schultz • NDVI and EVI cover map • Available for evaluation Schultz Phoenix Tucson Horseshoe 2 Monument USDA Forest Service, Remote Sensing Applications Center, http://fsweb.rsac.fs.fed.us
Schultz (2010) – Applied Results USDA Forest Service, Remote Sensing Applications Center, http://fsweb.rsac.fs.fed.us
Horseshoe 2 (2011) – Applied Results USDA Forest Service, Remote Sensing Applications Center, http://fsweb.rsac.fs.fed.us
Monument (2011) – Applied Results USDA Forest Service, Remote Sensing Applications Center, http://fsweb.rsac.fs.fed.us
Decision Support Tool • Tool for resource managers / line officers • When has the risk sufficiently lessened? USDA Forest Service, Remote Sensing Applications Center, http://fsweb.rsac.fs.fed.us
Decision Support Tool • Post-fire Watershed Planning Decision Support Process Define critical values Define AOI Acquire imagery and VI Summarize VI by AOI Probability of damage Identify risk More ESR work needed? USDA Forest Service, Remote Sensing Applications Center, http://fsweb.rsac.fs.fed.us
Comments / Questions? Jess Clark jesstclark@fs.fed.us 801-975-3769 USDA Forest Service, Remote Sensing Applications Center, FSWeb: http://fsweb.rsac.fs.fed.us WWW: http://www.fs.fed.us/eng/rsac/