Download
1 / 1
10 likes | 89 Views
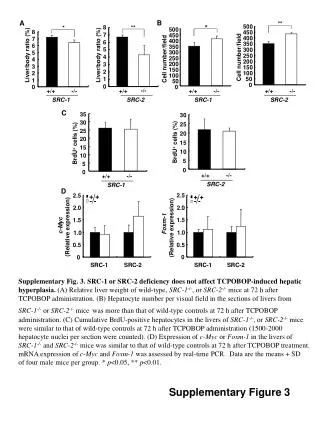
This study explores the effect of SRC-1 and SRC-2 deficiency on liver hyperplasia induced by TCPOBOP treatment. Results show no significant differences in liver weight, hepatocyte number, BrdU-positive cells, and c-Myc/Foxm-1 expression between wild-type and deficient mice.

E N D
+/+ +/+ +/+ +/+ -/- -/- -/- -/- SRC-2 SRC-2 SRC-1 SRC-1 B A ** * ** * 500 8 500 8 450 7 450 400 7 400 6 350 6 350 5 300 300 5 Liver/body ratio (%) Liver/body ratio (%) 250 4 Cell number/field 250 Cell number/field 4 200 200 3 3 150 150 2 100 2 100 1 50 1 50 0 0 0 0 -/- +/+ -/- +/+ SRC-1 SRC-2 C 35 30 30 25 25 20 20 BrdU+ cells (%) 15 BrdU+ cells (%) 15 10 10 5 5 0 0 D 2.5 2.5 +/+ +/+ -/- -/- 2.0 2.0 1.5 1.5 c-Myc (Relative expression) Foxm-1 (Relative expression) 1.0 1.0 0.5 0.5 0 0 SRC-1 SRC-2 SRC-1 SRC-2 Supplementary Fig. 3. SRC-1 or SRC-2 deficiency does not affect TCPOBOP-induced hepatic hyperplasia. (A) Relative liver weight of wild-type, SRC-1-/-, or SRC-2-/- mice at 72 h after TCPOBOP administration. (B) Hepatocyte number per visual field in the sections of livers from SRC-1-/- or SRC-2-/- micewas more than that of wild-type controls at 72 h after TCPOBOP administration. (C) Cumulative BrdU-positive hepatocytes in the livers of SRC-1-/-, or SRC-2-/- micewere similar to that of wild-type controls at 72 h after TCPOBOP administration (1500-2000 hepatocyte nuclei per section were counted). (D) Expression of c-Myc or Foxm-1 in the livers of SRC-1-/- and SRC-2-/- mice was similar to that of wild-type controls at 72 h after TCPOBOP treatment. mRNA expression of c-Myc and Foxm-1 was assessed by real-time PCR. Data are the means + SD of four male mice per group. * p<0.05, ** p<0.01. Supplementary Figure 3