Download
1 / 26
260 likes | 395 Views
Advancing Collaborative Connections for Earth System Science (ACCESS) Program. AeroStat: Online Platform for the Statistical Intercomparison of Aerosols. http://giovanni.gsfc.nasa.gov/aerostat/. Robert Levy, SSAI/GSFC (Co-I.) David Lary , U. of Texas at Dallas (Co-I.)

E N D
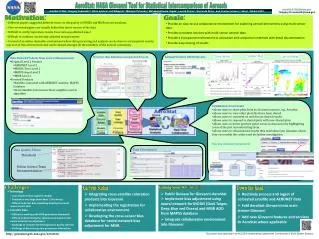
Advancing Collaborative Connections for Earth System Science (ACCESS) Program AeroStat: Online Platform for the Statistical Intercomparison of Aerosols http://giovanni.gsfc.nasa.gov/aerostat/ Robert Levy, SSAI/GSFC (Co-I.) • David Lary, U. of Texas at Dallas (Co-I.) Ralph Kahn, NASA/GSFC (Collaborator) Lorraine Remer, NASA/GSFC (Collaborator) Charles Ichoku(Collaborator) Gregory Leptoukh, NASA/GSFC (P.I.) Chris Lynnes, NASA/GSFC (Acting P.I.) Peter Fox, RPI (Co-I.) Jennifer Wei, Adnet/GSFC (Project Lead) M. Hegde, Adnet/GSFC (Software Lead) Contributions from S. Ahmad, R. Albayrak, K. Bryant, D. da Silva, J. Amrhein, F. Fang, X. Hu, N. Malakar, M. Petrenko, L. Petrov, C. Smit
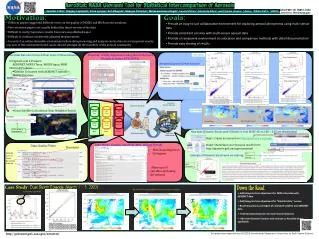
Outline Why AeroStat? Aerostat Features DEMO AeroStat Under the Hood Achievements / Results Going Forward
Motive #1: Differences among aerosol measurements • Different instruments and algorithms have different measurement characteristics • Spatial coverage • Spatial consistency • Temporal consistency • Diurnal coverage • Vertical sensitivity • Sensitivity to sunglint, clouds, surface reflectance, aerosol types, ...
Motive #2: For phenomena such as dust transport, getting a full picture is challenging
Aerostat is an environment for aerosol comparison and collocation with supporting documentation • Essential documentation: Read Me First, quality statements, disclaimers, processing documentation, lineage... • Compare satellite w/ground-based aerosol measurements • Scatterplot • Time Series • Explore aerosol phenomena by merging multi-sensor data • Experiment with quality filter settings and bias adjustment • Save and share findings (and questions)
DEMO http://giovanni.gsfc.nasa.gov/aerostat/ (Please, try it out, it’s operational.)
Aerostat architecture pulls together several ACCESS-related resources scatterplot timeseries map matchup merge/grid adjust GSocial Giovanni MAPSS Database Talkoot MAPSS fetch query cache search OpenSearch MODIS L2 MISR L2 Aeronet ASDC LAADS ECHO Aeronet: AErosolROboticNETwork ASDC: Atmospheric Science Data Center (LaRC) ECHO: EOS Clearinghouse LAADS: Level 1 and Atmosphere Archive and Distribution System MAPSS: Multi-sensor Aerosol Products Sampling System
GSocial: a reusable social annotation service • Incorporates Talkoot Research Notebook • Based on Drupal 6 • Despite its name, GSocial can be integrated with other REST-based applications • Proof of concept with SeaWiFS True Color application • Plans to integrate with Hook Hua’s ACCESS project • Currently in use by Aerostat developers for testing and review preparation • Still a work in progress...
Neural Net Bias Adjustment • Goal: • Adjust data to a common baseline to facilitate merging • Explore sources of difference among measurements • Original plan: • Linear regression, and • Support vector machine • Revised plan: neural network adjustment • Linear regression complicated by: • Non-Gaussian distribution • Different bias causes at low AOD vs. high AOD values • Many small contributors to bias, not one or two large ones • Neural network previously used by A. da Silva and R. Albayrak
Neural Net Process Offline Processing Online Processing Data Preparation Read netCDF file MAPSS database Aeronet AOD Satellite AOD + “regressors” ReadAOD Read Regressors Data Matrix Data Matrix Python NN module (ffnet) Learn AOD Bias – (back-prop) feed NN coefficients Adjust Bias test train coeff. Update netCDF file
Neural Network Caveats • NN Tendency to smooth out outliers may not always be desired • Hard to pin down adjustment to a few readily understandable factors, but... • ...we can see some of the factors in an exhaustive study of regressor influence by David Lary et al.
Relevant Factors Study Run full neural network train/test cycle for all 32781 possible combinations Mutual Information used as proxy for effectiveness
Coming soon... • Summer Internships • Aerostat Mobile Apps, targeting applications • Interactive client-side visualization • Linked scatterplot-map • “Where are these outliers located?”
AeroStat Recap • Comparing aerosol data from different sensors is difficult and time consuming for users • AeroStat provides an easy-to-use collaborative environment for exploring aerosol phenomena using multi-sensor data • The result should be: • More consistency in dealing with multi-sensor aerosol data • Easy sharing of results • With less user effort
Collaboration Features Mark (tag) and categorize an interesting feature and/or anomaly in a plot View marked-up features in plots related to the one currently being viewed Save bias calculation Save fusion request settings (tag, comment, share a la Facebook) Bug report tags Provide user with list of tags (created by other users) for similar datasets Ability to re-run workflows from other user tags Have a "My Contributions" option, where user can click on previously tagged items, re-run workflow, view plots)
Percent of Biased Data in MODIS Aerosols Over Land Increase as Confidence Flag Decreases *Compliant data are within + 0.05 + 0.2τAeronet Statistics from Hyer, E., J. Reid, and J. Zhang, 2010, An over-land aerosol optical depth data set for data assimilation by filtering, correction, and aggregation of MODIS Collection 5 optical depth retrievals, Atmos. Meas. Tech. Discuss., 3, 4091–4167.