Download
1 / 1
10 likes | 85 Views
This study explores the correlation between optical indices, such as the Water Band Index (WBI), and carbon/water fluxes in a chaparral ecosystem from 2001 to 2003. Results show WBI is a robust estimator of H2O flux. Factors affecting WBI include precipitation, species, and canopy structure. Remote sensing can directly estimate water fluxes. Careful examination is needed due to noise in the WBI region. The study indicates a close correlation between WBI and water flux, emphasizing the ecosystem's water dependency.

E N D
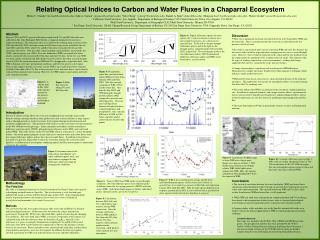
Relating Optical Indices to Carbon and Water Fluxes in a Chaparral Ecosystem Helen C. Claudio1 (hclaudi@calstatela.edu), John A. Gamon1 (jgamon@calstatela.edu), Yufu Cheng1 (ycheng5@calstatela.edu), Daniel A. Sims2 (dsims@bsu.edu), Hongyan Luo3 (luo@sunstroke.sdsu.edu), Walter Oechel3 (oechel@sunstroke.sdsu.edu) 1 California State Univeristy, Los Angeles, Department of Biological Sciences 5151 State University Drive, Los Angeles, CA 90032 2 Ball State Univeristy, Department of Geography CL425 Ball State University, Muncie IN 47306 3 San Diego State University, Global Change Research Group Department of Biology, PS-240 San Diego State University 5500 Campanile Drive, San Diego, CA 92182 Abstract Between 2001 and 2003, spectral reflectance coupled with CO2 and H2O flux data were collected at Sky Oaks Biological Field Station, a chaparral-dominated ecosystem in southern California. The reflectance data were collected by walking along a transect (early 2001 and after July 2003) and semi-automated 100 meter tram system installed at the site (mid 2001 until July 2003), while CO2 and H2O flux data were gathered with an eddy covariance flux tower. Over the study, which included a normal (2001), an extremely dry (2002), and a recovery year (2003), the water band index (WBI) was found to be more closely correlated with ecosystem H2O flux than with the CO2 flux. In the wet year, WBI was more closely correlated with both the H2O and CO2 fluxes, but when a record drought struck in 2002, the correlation between WBI and CO2 disappeared as vegetation died. Also, WBI is dynamic over time, precipitation conditions, and between species in the region. These results suggest that the ecosystem average WBI is an overall more robust estimator of the H2O flux than of the CO2 flux at the ecosystem level, and water fluxes can be directly estimated from optical remote sensing. However, the WBI region is noise-prone and needs to be examined carefully. • Discussion • There was a significant statistical correlation between water band index (WBI) and the water flux. This is an indication that the ecosystem is indeed driven by the presence or lack of water. • Sky Oaks is a particularly good site for correlating WBI and water flux because the data cover wide variations in precipitation, ranging from wet years to record drought years. However, there is limited vegetation in the region and the low productivity in the region makes the amplitude of the readings relatively small. This contrasts with the types of readings expected in a wetter environment – readings with larger amplitudes but with less variation due to the lack of extremes. • Canopy structure plays a significant role in interspecies WBI differences. Manzanita, for example, has larger, broader leaves than chamise or redshank, which both have small, needle-like leaves. • WBI and CO2 flux do not always have a clear correlation because of the lead and lag effects. This model does not account for atmospheric effects or seasonal changes that affect the CO2 exchange rates. • The results indicate that WBI is an indicator of the ecosystem evapotranspiration rate. In addition to temporal dynamics and canopy structure effects, environmental factors such as relative humidity and temperature, and physiological effects such as stomatal conductance are also key factors in modelling evapotranspiration and CO2 flux. • The water band region at 970nm is particularly sensitive to noise and background moisture. Figure 4: Typical reflectance spectra for each species (Af = Adenostoma fasciculatum, Ap = Arctostaphylos pungens, As = Adenostoma sparsifolium). To the left are the pre-drought reflectance spectra and to the right are the drought spectra, taken December 2001 and July 2002, respectively. The wavelengths used for the two reflectance indices, NDVI (normalized difference reflectance index) and WBI (water band index), are also shown. Figure 5: Precipitation, water flux, and water band index (WBI) over time from January 2001 until July 2003. Note the seasonal variations in WBI, NDVI, and the water flux. Also note the low NDVI and WBI during the drought period (summer 2002) compared to previous and following years. There are also lead-lag effects between the optical indices, evapotranspiration, and precipitation. Also, note the difference in WBI in 2001 before and after quality control checks for poor data points. Figure 1: A contour map of Sky Oaks (left) with the location of the transect, flux ttower, and footprint marked. Figure 2: Eddy flux tower for taking CO2 and H2O flux data. Introduction The use of remote sensing allows for ecosystem sampling that are normally inaccessible. Remote sensing can range anywhere from global scale such as from satellites or large regions such as through aircrafts or small (ecosystem level) regions through localized manual and automatic sampling devices. This particular study focuses on the ecosystem level measurements in the 400-1000nm wavelength range. Some commonly used indices include normalized difference vegetation index (NDVI), photochemical reflectance index (PRI), and water band index (WBI). This study focuses on the 970 nm WBI, which is a measure of a water absorption feature. One of the primary purposes in this study are to correlate water and carbon fluxes with the various reflectance indices and use these data to model fluxes. In addition to local fluxes, this study is a part of a larger effort to run cross-ecosystem analyses by a network called SpecNet, a collaboration of investigators combining optical and flux measurements to understand ecosystem flux controls. Figure 3: Instrumentation of the tram system including the cart, white calibration panel, track, and spectrometers equipped to take reflectance while correcting for changing sky conditions. Figure 9: Transformed AVIRIS image to show WBI over a larger space. Image was taken on October 3, 2002. Darker areas indicate areas of high relative WBI, while lighter areas indicate low WBI. Here, the riparian cooridor has been highlighted to show the contrast in WBI. Figure 10: A sample reflectance spectra (June 7, 2001) with an oxygen absorption feature at 760-765 nm and noise in the 930-1000 nm region. The water absorption region is prone to noise and this noise (zig-zags) confound WBI. Figure 7: WBI of the overall transect average and the three individual dominant species (Adenostoma. fasciculatum, A. sparsifolium, Arctostaphylos pungens) at Sky Oaks over time from January 2001 until July 2003. Note the inter-species differences in response, particularly in 2003: A. fasciculatum and A. sparsifolium show a greater extent of recovery than does A. pungens. • Conclusion • The statistical correlation between the water band index (WBI) and water flux is significant, indicating optical remote sensing can provide direct information on water status and evapotranspiration. The correlation between WBI and CO2 flux, while weaker than between WBI and water flux, is still significant. • While WBI can yield some information on evapotranspiration and CO2 exchange, there needs to be incorporation of other factors, such as structural, physiological, meteorological, and environmental factors, to generate more dynamic models. • Ongoing studies at this and other sites in the SpecNet network will enable us to further evaluate the general applicability of WBI to evapotranspiration and carbon exchange. Figure 6: Transect NDVI and WBI under wet and drought conditions. Note that different species have different peaks at different times due to varying greenness (NDVI) and water status (WBI). Individual shrubs appear as distinct, individual peaks, especially in the case of Arctostaphylos. Methodology The Field Site Sky Oaks is a chaparral vegetated site located in northern San Diego County and is part of a developing network known as Spec-Net. The site of interest is a site that had gone unburned for nearly a century and then burned again in July 2003. Some dominant plant species of particular interest are chamise (Adenostoma fasciculatu), redshank (A. sparsifolium) and manzanita (Arctostaphylos pungens).. Methods CO2 and water flux data were gathered using an eddy tower with an IRGA CO2 detector and meteorlogical analyzers. Reflectance data were taken by using a dual detector spectrometer (UnispecDC, PP Systems, Haverhill MA) capable of correcting for changing sky conditions. The water band index (WBI), a measure of vegetation water content, was calculated using with the reflectance data; the formula is R900/R970, where Rx is the reflectance at a given wavelength. Simultaneous sampling of CO2 and H2O fluxes and reflectance from 2001 to 2003 allows for comparisons to observe the dynamics of water status in the ecosystem. Fluxes and indices were correlated with each other, and the effects of precipitation and species were also investigated. In addition, the data were quality checked, particularly the NIR (near-infrared region) for noise and other difficulties. Figure 8: Correlations between H2O (left) and CO2 (right) fluxes with transect average WBI respectively. Note the stronger correlation between WBI and H2O flux than with CO2 flux. For the CO2 flux, negative values indicate uptake into the ecosystem, while positive values indicate loss into atmosphere. Acknowledgements: This study was funded by the NCEAS, CEA-CREST and NSF Ecosystems grants. The precipitation and flux data were provided by Dr. Walter Oechel’s Global Change Research Group at San Diego State University. I also want to thank everyone in the VCSARS lab for giving me helpful insights along the way and keeping my morale up during difficult times.