First results by IGEC2
360 likes | 587 Views
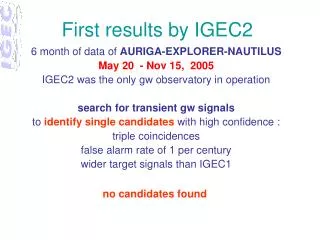
First results by IGEC2. 6 month of data of AURIGA-EXPLORER-NAUTILUS May 20 - Nov 15, 2005 IGEC2 was the only gw observatory in operation search for transient gw signals to identify single candidates with high confidence : triple coincidences false alarm rate of 1 per century

First results by IGEC2
E N D
Presentation Transcript
First results by IGEC2 6 month of data of AURIGA-EXPLORER-NAUTILUS May 20 - Nov 15, 2005 IGEC2 was the only gw observatory in operation search for transient gw signals to identify single candidateswith high confidence : triple coincidences false alarm rate of 1 per century wider target signals than IGEC1 no candidates found
Samples of target signals A New Mechanism for the Gravitational Wave Signatures of Core-Collapse Supernovae, C.D. Ott, A. Burrows, L. Dessart, and E. Livne, Phys. Rev. Letters, 96, 201102, 2006. Dominant gw emission: g-modes of the proto-neutron-star core sources at 10 kpc G.A.Prodi, WG2 Oct.25, 2006
Strain Noise Amplitude of IGEC2 detectors G.A.Prodi, WG2 Oct.25, 2006
IGEC2 data preparation • Each group implements a search optimized for -like signals (amplitude H [Hz-1] = Fourier component of h, gw strain) and validates its observation. • Cross check by using AURIGA Data Analysis on a sample day of raw data of EX and NA : agreement on most candidate events with SNR > 4.5 - 5.0 • Exchanged data set: Fri May 20 - Tue Nov 15, 2005, same protocol as IGEC1 but a time shift is added to the true time (blind analysis) • AU exchanged on April 19, 2006 • ROG exchanged EX and NA data on July 5 • ALLEGRO had difficulties in producing data: we agreed to proceed anyway and use ALLEGRO data for a follow-up investigation of any candidate found. G.A.Prodi, WG2 Oct.25, 2006
96 % 88 % 86 % 3-fold OPERATION TIME AURIGA- EXPLORER- NAUTILUS 180 days HIGH DUTY CYCLE • no detector 0.6 days • Single 3.6 days • Double 45.0 days • Triple130.8days 73% days of exchanged data G.A.Prodi, WG2 Oct.25, 2006
Observation time of the INFN detectors as a functionof amplitude threshold Ht. Y-axis: integrated time during which the detector exchange threshold has been lower than Ht Amplitude Ht[10-21 Hz-1] G.A.Prodi, WG2 Oct.25, 2006
Three-Fold Observation Timeof AU-EX-NA vs amplitude threshold Amplitude Ht[10-21 Hz-1] G.A.Prodi, WG2 Oct.25, 2006
candidate event amplitudes versus time (blu: NA, green:EX, red:AU) H [Hz-1] G.A.Prodi, WG2 Oct.25, 2006
Event amplitude distributionsAU: SNR>4.5 NA: SNR>4EX: SNR>4 #events Amplitude H [Hz-1] G.A.Prodi, WG2 Oct.25, 2006
Auto Correlograms AU-AU NA-NA sec sec EX-EX sec G.A.Prodi, WG2 Oct.25, 2006
Cross Correlograms AU-NA AU-EX sec sec NA-EX sec G.A.Prodi, WG2 Oct.25, 2006
Time of arrival uncertainty:AU (Red), NA-EX (Blue) Conservative estimates of t for a ms pulse Systematic errors for longer signals are likely to be similar in different detectors G.A.Prodi, WG2 Oct.25, 2006
IGEC2 search for gw (1) Triple coincidence search AU-EX-NA • blind search: tune analysis before looking for true coincidences. Criteria: • set overall false alarm rate =1 per century; • search for -like signals (IGEC1 style: equal H amplitude in the different detectors) • search for some classes of colored signals • time windowfor coincidence search (IGEC1 style): Abs [ta –tb] < bt sqrt [s2ta + s2tb ]for the 3 detector pairs bt=4.47 to ensure a contribution to false dismissal < 15% according to Byenaimé-Tchebychev assuming a signal with ms duration • analysis pipeline under responsibility of AURIGA. Independent checks on results by ROG; G.A.Prodi, WG2 Oct.25, 2006
Distribution of accidental coincidencesall exchanged events AU: SNR4.5 NA: SNR 4 EX: SNR 4 Entries 1879417 Mean 2.415 2/ndf 12.6 /12 G.A.Prodi, WG2 Oct.25, 2006
IGEC2 search for gw (2) • perform only ONE composite search made by • the OR among the following data selections: • SNR > 4.95 for AU, EX and NA 0.396 false alarm /century targets signals peaked on EX-NA sweet spots • SNR > 7.00 for AU, SNR>4.25 for EX and NA 0.572 false alarm /century targets signals barely detectable by EX and NA • common absolute thresholds IGEC1-style: thresholds 1.3, 1.4, 1.5, ..., 3.0 x 10⁻²¹/Hz 0.134 false alarm /century targets -like signals 130.8 days of net simultaneous observation time by the three INFN resonant bar detectors G.A.Prodi, WG2 Oct.25, 2006
Trial #1: same SNR thresholds G.A.Prodi, WG2 Oct.25, 2006
Trial #2: different SNR thresholds G.A.Prodi, WG2 Oct.25, 2006
target 0.5 false alarm / centuryAU SNR vs EX&NA SNRs AU-SNR=4.95 NA-SNR=4.95 EX-SNR=4.95 FA/Century=0.40 AU-SNR=7.00 NA-SNR=4.25 EX-SNR=4.25 FA/Century=0.40 AU-SNR=8.00 NA-SNR=4.25 EX-SNR=4.25 FA/Century=0.38 G.A.Prodi, WG2 Oct.25, 2006
CUMULATIVE AMPLITUDE DISTRIBUTIONS OF EXCHANGED EVENTS NA-SNR=4.25 351375 EX-SNR=4.25 245000 AU-SNR=4.95 34598 NA-SNR=4.95 42028 EX-SNR=4.95 29217 AU-SNR=7.00 790 AU-SNR=8.00 552 G.A.Prodi, WG2 Oct.25, 2006
Distribution of accidental coincidences Empirical estimate of the probability of a false detection: 3.63 10-3 1.0 false alarm / century statistical uncertainty 1 0.02 10-3 systematic uncertainty below 0.1 10-3 tested with independent pipelines & choices of time shifts The accidental coincidences are the “union” of the accidental coincidences for each data selection: it takes into account the correlations between different trials counting only once each accidental coincidence. G.A.Prodi, WG2 Oct.25, 2006
Plan for the statistical data analysis (1) • Testing the null hypothesis Null hypothesis will be rejected if at least 1 coincidence is found in the “on-source” analysis • In case the null is not confirmed: • the coincidence is not explained by the accidental coincidences with 99.637% 0.006% (3) confidence (coverage), i.e. the collaboration excludes it is an accidental coincidence; • the coincidence can be caused by any source of correlated noise or signal among the detectors outputs, also gravitational waves; A rejection of the null is a claim for an excess correlation in the observatory at the true time, not taken into account in the measured accidental noise at different time lags. It may NOT be gws, it may be correlated noise, but a paper reporting the null rejection is worthwhile and due. It is useful in pointing to possible problems in the analysis procedures (accidental coincidences estimation) and to hardware problems (instrumental correlations). G.A.Prodi, WG2 Oct.25, 2006
Plan for the statistical data analysis (2) • follow-up investigation to characterize any coincidence “a posteriori”: • additional checks for mistakes in the network analysis; • it will not affect the confidence of the rejection of the null; • the follow-up results will be interpreted in terms of likelihood or “degree of belief” (subjective confidence) by the collaboration; • investigation on h(t) data will try to discriminate among known possible sources (gravitational waves, electromagnetic or seismic disturbances, …). The h(t) data will be filtered to implement network searches based on cross-correlation and wavelet transform (warning: in case the SNR of the candidates is low, we do not expect to get significant information); • Data from ALLEGRO will be added, in particular h(t) and list of candidates. The improvement in false alarm rate will be estimated, but it is difficult to take into account the efficiency of detection; • IGEC2 will investigate on simultaneous observations by other kind of detectors (neutrinos, gamma, x …). G.A.Prodi, WG2 Oct.25, 2006
Plan for the statistical data analysis (3) • Set a confidence interval on the estimated number of coincidences due to any source of correlated noise or signal. It will be conservative, i.e. ensuring a minimum coverage. • confidence belt construction: • Based on Feldman&Cousins construction; • the noise model is a Poisson distribution fitting the empirical estimates of the accidental coincidences; • to take into account uncertainties in the noise model, consider the union of the confidence belts given by the mean noise b 3 • b = 0.00364 0.00006 events G.A.Prodi, WG2 Oct.25, 2006
Plan for the statistical data analysis (4) • At last, we “opened the box” on Sept. 25 after exchanging the secret time shifts ……no candidates were found. …the usual upper limit… • Comparison with the upper limits given by the IGEC 1997-2000 observations is possible using a subset of the current analysis: the IGEC1-style search targeting -like signals Burst Rate [year-1] IGEC2 upper limit 95% coverage G.A.Prodi, WG2 Oct.25, 2006 Burst amplitude [Hz-1]
Final remarks ... Strengths • 3 bar detectors easily surveywith high duty cycle and very low false alarms: possible identification of single candidates at low SNR with very high confidence; • IGEC2 searches for a broader class of signals than IGEC1; • The blind search in the statistical sense makes the statistical interpretation non-controversial Weaknesses: • IGEC2 (as IGEC1) lacks a measurement of detection efficiency • Interpretation of the confidence interval in terms of equivalent gravitational waves from a selected source model is NOT possible (efficiency measurements have been performed in VIRGO-bars) • The tuning of the analysis considered only generic predictions of the detection efficiency • Poor sensitivity with respect to LIGO IGEC2 upper limits not interesting any more G.A.Prodi, WG2 Oct.25, 2006
... Final remarks Short term opportunities: • improved methodologies of network data analysis are feasible: exploit full information of h(t) channels (coherent data analyses) • IGEC2 has been requested to collaborate with LIGO during its current scientific run: we are now ready to define this joint research program G.A.Prodi, WG2 Oct.25, 2006
AURIGA: response to dampedsinusoids hrss = 1e-19 Measured H [Hz-1] G.A.Prodi, WG2 Oct.25, 2006
NAUTILUS: response to dampedsinusoids hrss = 1e-19 Measured H [Hz-1] G.A.Prodi, WG2 Oct.25, 2006
EXPLORER: response to dampedsinusoids hrss = 1e-19 Measured H [Hz-1] G.A.Prodi, WG2 Oct.25, 2006