Download

1 / 27
270 likes | 494 Views
Invest 2.2.1 Nutrient Retention model. Yonas Ghile. Why Nutrient Retention model?. ~ 14,000 people die daily G lobal water treatment cost ~$24.6 billion/year Dead fish zone in the Gulf of M exico ~5, 000 mil 2 Non-Point Source is major cause . Biophysical Inputs. Soils

E N D
Invest 2.2.1 Nutrient Retention model YonasGhile
Why Nutrient Retention model? • ~ 14,000 people die daily • Global water treatment cost ~$24.6 billion/year • Dead fish zone in the Gulf of Mexico ~5, 000 mil2 • Non-Point Source is major cause
Biophysical Inputs Soils Soil depth, PAWC Climate Precp, PET Topography Digital elevation model, slope threshold Watershed Areas Main and sub for point of interest and water quality analysis Land Use/Land Cover Nutrient loading, Retention capacity, root depth, crop coefficient
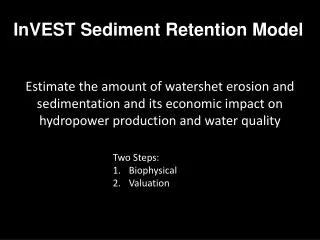
1. Estimate Water yield 3. Estimate Pollutant Load value 2. Calculate flow direction Corn forest 4. Estimate nutrient retained wheat 5. Estimate pollutant reached the stream
Valuation 6. Estimate Avoided treatment costs Critical Loading Loading Time
Some Questions • Where are the pollutant sources? • Where are the pollutant retention areas? • How much is retained? • What is the Value of this retention?
Informs Policy Makers to • Protect areas that retain most • Design management practices that lead to maximum retention • Create payment programs to get most return on investment • Identify services that conflict with water purification • How much retention will we gain or lose under future management or conservation plans?
Strengths • Uses readily available and minimum data • Simple, applicable and spatially explicit • Link the biophysical functions to economic values • Values each parcel on the landscape
Limitations • All bio-physio-chemical processes are lumped in one number export coefficient • Annual basis, misses seasonality • No instream processes and point sources • Less relevant to areas dominated by infiltration excess • Assess one pollutant per run • No saturation in uptake
Model Calibration and Testing • Sensitivity Analysis to identify most sensitive parameters • Model Calibration using long term average actual data • Find crop coefficient and root depth within acceptable ranges • Model parameter (Zhang constant) • Find export coefficients and vegetation efficiencies within acceptable ranges • Validate Model by conducting comparisons with observed data or other model output
Hainan Island, China Phosphorus loads (kg/yr)
Hainan Island, China Nitrogen Loads (kg/yr)
Hands-on Session • Run the water yield model
Hands-on Session • Run the nutrient retention model
Hands-on Session • Run the valuation model
Hainan Island, China No Expansion Actual (2008) IEM RNF Increase No change Decline
Baoxing, China Retained TN Retained TP High High Low Low
Scenarios for Mine Expansionin Columbia Permits Granted Current Mines All possible permits Permits Pending
Columbia Change in Nitrogen Export (kg/ha/yr) Permits Pending All possible Permits Permits Granted
Columbia High Impact Zones should avoided Permits Granted Permits Pending All possible Permits
Coming up soon • Improve vegetation retention rates • Include Point source pollutant • Include bacterial contamination • Improve pollutant load adjustment • Tier 2 nutrient retention model
Hands-on Session Any idea how you would use theNutrient Retention Model in your work?
How Does it Work? • Pollutant Load Value: • Hydrologic Sensitivity Score: • Adjusted Loading Value: = =log *
How Does it Work?... Corn forest Pollutant input Y wheat forest Stream
How Does it Work?... Removal of polluntats by vegetation and soil along the flowpaths is calculated as follows
Valuation Critical Loading Loading Time