Download
1 / 40
400 likes | 499 Views
Explore findings from Lubbock regional meeting on water usage in cotton farming, with a focus on efficiency, cost, and yield potentials in various irrigation scenarios. Discover key insights for maximizing profits and sustainability in water management.

E N D
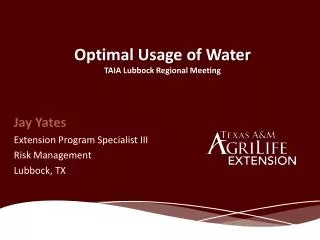
Optimal Usage of WaterTAIA Lubbock Regional Meeting Jay Yates Extension Program Specialist III Risk Management Lubbock, TX
Texas Southern High Plains Irrigation Situation • Declining capacity • Increased efficiency • Increasing energy costs • Varieties with higher potential yields
FARM Assistance Analysis • Looked at the following cotton alternatives: • Fully irrigate 120 acre pivots with 300 gpm each • Irrigate 1/2 pivots, treat the rest as dryland • Irrigate 2/3 pivots, treat the rest as dryland • Drill new wells to irrigate entire pivots on owned land with 600 GPM • Drilling 4 new wells for the 4 pivots on owned land at a cost of $40,000 each • Water ½ pivots on rented ground * None of the alternatives included DCP Program Direct Payments
“Whiskey is for drinkin’, water is for fightin’ over” Mark Twain
Observations From 2011 • TTU Lubbock Mesonet Site • 45.75” Cumulative Reference ET from 4/15 – 9/15 • 2.36” Rainfall during the same period • 98 days of 95 degrees or more • 58 days of 100 degrees or more • Official Lubbock record of 48 breaks old record from 1934 of 29 • 3 bale cotton in 2011 took from 21-35 ac/in with 4-5 gpm per acre capacity • Well irrigated pivots and drip had significantly higher net returns
Petersburg, Texas Dryland planted May 4 – Picture taken August 25, 2011
Shallowater, Texas Pre-watered Only Planted May 4 – Picture taken August 25, 2011
North of Petersburg, Texas Yield .9 BPA Sub-Surface Drip, 1.5 GPM per acre – Picture taken August 25, 2011
Petersburg, Texas Yield 1.5 BPA Sub-Surface Drip, 2.5 GPM per acre – Picture taken August 25, 2011
Lubbock, Texas Yield 3.3 BPA Sub-Surface Drip, 4.1 GPM per acre – Picture taken August 25, 2011
Sandhill, Texas Yield 3.5 BPA Sub-Surface Drip, 4.5 GPM per acre – Picture taken August 25, 2011
South of Shallowater, Texas Yield 3.95 BPA Sub-Surface Drip, 6 GPM per acre – Picture taken August 25, 2011
Not Much Better in 2012 • TTU Lubbock Mesonet Site • 41.13” Cumulative Reference ET from 4/15 – 9/15 • 6.24” Rainfall during the same period • 69 days of 95 degrees or more • 25 days of 100 degrees or more • Official Lubbock record prior to 2011 was 29 from 1934 • Official Lubbock record of 24 tied for 5th most with 1924 • 3 bale cotton in 2012 took only slightly less irrigation than 2011 • Well irrigated pivots and drip had significantly higher net returns
Not as Hot and Dryin 2013But still above average • TTU Lubbock/Reese Mesonet Site • 42.09” Cumulative Reference ET from 4/15 – 9/3 • Would expect another 2.5” over next 2 weeks based on forecasts, making 2013 as high of ET as 2011 • 7.82” Rainfall during the same period • Normal rainfall is 11.24” for this period • 33 of top 36 driest periods on record for Lubbock come between 9/15 and 4/15. (That’s why winter wheat is not as successful here) • 48 days of 95 degrees or more • 13 days of 100 degrees or more • Still warmer than average (~10 days/year), but closer to average temperature compared to the past 2 years.
Comparative Profit Analysis 2011 • Interviewed area farmers • Collected data from AgriLife Research & Extension Projects
The Study Group • 31 Cotton Farm Sites • 17 Sub-Surface Drip (all on 80” centers) • 13 Center Pivots • 2 MESA • 1 LESA • 10 LEPA • 1 Furrow • GPM/Acre ranging from 1.5 to 6.0
2011 Cotton Yields vs. Water Applied Cotton Yield lbs/acre Inches of Water Applied per Acre
2011 Returns Above Direct Costs at $0.90/lb vs. Water Applied at $9/in Returns Above Direct Costs > 4 gpm/ac Inches of Water Applied per Acre
2011 Cotton Net Profit at $0.90/lb vs. Water Applied at $9/in Returns Above Direct Costs > 4 gpm/ac Inches of Water Applied per Acre
2011 Returns Above Direct Costs at $0.52/lb vs. Water Applied at $9/in Returns Above Direct Costs Inches of Water Applied per Acre
2011 Cotton Net Profit at $0.52/lb vs. Water Applied at $9/in Returns Above Direct Costs Inches of Water Applied per Acre
2011 Returns Above Direct Costs at $0.90/lb vs. Water Applied at $15/in Returns Above Direct Costs Inches of Water Applied per Acre
2011 Cotton Net Profit at $0.90/lb vs. Water Applied at $15/in Returns Above Direct Costs Inches of Water Applied per Acre
What Does It Take To Apply 20-25 Inches of Irrigation? * Assumes 125 acre pivot and irrigating season from April 15 to September 15
Conclusions • In 2011 with virtually no sub-soil moisture or rainfall during the growing season, it took at least 4 gpm/acre to make a profitable cotton crop. • Long term analysis shows that systems with the ability to deliver less than 3 gpm/acre would be more profitable cutting irrigated acreage back to that level. • Irrigation profitability is more sensitive to lower cotton prices than higher energy prices. • Expected price level for 2013 would indicate that profitable irrigated yields are still attainable.
Factors Affecting Planting Decisions • Personal Preference • Risk Avoidance • Potential Profitability • Long Term Sustainability
Comparative Farm Scenarios 2013 • Irrigated Acres – 125 • Total Cropland Acres – 160 • Irrigation Capacity – 350 GPM • Number Days to Irrigate – 120 • Acre-inches per Irrigated Acre - 18
Comparative Farm Scenarios 2013 • Scenario 1 • Cotton – Irrigated (950 lb APH, 65%) – 125 ac. • Cotton – Dryland (250 lb APH, 65%) – 35 ac. • Percent Irrigation Capacity Used – 67% • Return Over Direct Expenses - $61,852 • Insurance Coverage Ratio – 109%
Comparative Farm Scenarios 2013 • Scenario 2 • Corn – Irrigated (185 bu APH, 65%) – 62.5 ac. • Sorghum – Irrigated (75 bu APH, 65%) – 62.5 ac. • Sorghum – Dryland (30 buAPH, 65%) – 35 ac. • Percent Irrigation Capacity Used – 93% • Return Over Direct Expenses - $26,015 • Insurance Coverage Ratio – 89%
Comparative Farm Scenarios 2013 • Scenario 3 • Sesame – Irrigated (675 lb APH, 65%) – 125 ac. • Sesame – Dryland (450 lb APH, 65%) – 35 ac. • Percent Irrigation Capacity Used – 62% • Return Over Direct Expenses - $79,040 • Insurance Coverage Ratio – 80%
Comparative Farm Scenarios 2013 • Scenario 4 • Corn – Irrigated (185 bu APH, 65%) – 80 ac. • Sunflowers – Dryland (556 lb APH, 65%) – 80 ac. • Percent Irrigation Capacity Used – 86% • Return Over Direct Expenses - $32,036 • Insurance Coverage Ratio – 86%
Comparative Farm Scenarios 2013 • Scenario 5 • Corn – Irrigated (185 bu APH, 65%) – 80 ac. • Cotton – Dryland (250 lb APH, 65%) – 80 ac. • Percent Irrigation Capacity Used – 86% • Return Over Direct Expenses - $26,910 • Insurance Coverage Ratio – 85%
Comparative Farm Scenarios 2013 • Scenario 6 • Corn – Irrigated (185 bu APH, 65%) – 80 ac. • Sesame – Dryland (450 lb APH, 65%) – 80 ac. • Percent Irrigation Capacity Used – 86% • Return Over Direct Expenses - $34,900 • Insurance Coverage Ratio – 91%
Comparative Farm Scenarios 2013 Insurance Coverage Ratio Irrigation Capacity Usage
Jay Yates Extension Program Specialist III Risk Management FARM Assistance Analyst • Contact Information: • Texas A&M AgriLife Research • and Extension Center • 1102 East FM 1294 • Lubbock, TX 79403 • (806) 746-6101 • jayates@ag.tamu.edu • http://lubbock.tamu.edu • http://agrilife.org/southplainsprofit • http://agrilife.org/southplainscotton • https://www.facebook.com/FARMAssistance South Plains Cotton Update every Thursday at 1:00 – 2:30 p.m. during West Texas Ag Life on