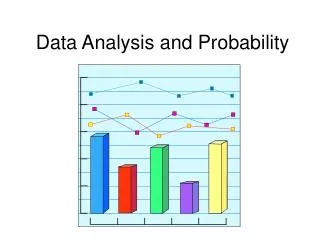

Data Analysis and Probability
E N D
Presentation Transcript
Data Analysis and Probability Chapter 12
12.2 Frequency and Histograms • Pg. 732 – 737 • Obj: Learn how to make and interpret frequency tables and histograms. • Content Standards: S.ID.1 and N.Q.1
12.2 Frequency and Histograms • Frequency – the number of data values in an interval • Frequency Table – groups a set of data values into intervals and shows the frequency for each interval • Histogram – a graph that can display data from a frequency table • Cumulative Frequency Table – shows the number of data values that lie in or below a given interval
12.3 Measures of Central Tendency and Dispersion • Pg. 738 – 744 • Obj: Learn how to find mean, median, mode, and range. • Content Standards: S.ID.2, S.ID.3, and N.Q.2
12.3 Measures of Central Tendency and Dispersion • Measures of Central Tendency – mean, median, and mode • Outlier – a data value that is much greater or less than the other values in the set • Mean – sum of the data values/total number of data values • Median – the middle value of a data set when the values are arranged in order
12.3 Measures of Central Tendency and Dispersion • Mode – the data item that occurs most often • Measure of Dispersion – describes how spread out the data values are • Range of a set of data – the difference between the greatest and least data values
12.4 Box-and-Whisker Plots • Pg. 746 – 751 • Obj: Learn how to make and interpret box-and-whisker plots and to find quartiles and percentiles. • Content Standards: S.ID.2, N.Q.1, and S.ID.1
12.4 Box-and-Whisker Plots • Quartiles – values that divide a data set into four equal parts • Interquartile Range – the difference between the third and first quartiles • Method for Summarizing a Data Set • Arrange the data set in order from least to greatest • Find the minimum, maximum, and median • Find the first quartile and third quartile
12.4 Box-and-Whisker Plots • Box-and-Whisker Plot – a graph that summarizes a set of data by displaying it along a number line • Percentiles – separate data sets into 100 equal parts • Percentile Rank – the percentage of data values that are less than or equal to the value
12.7 Theoretical and Experimental Probability • Pg. 769 – 774 • Obj: Learn how to find theoretical and experimental probability. • Content Standards: S.CP.1 and S.CP.4
12.7 Theoretical and Experimental Probability • Outcome – the result of a single trial • Sample Space – all the possible outcomes • Event – any outcome or group of outcomes • Probability – tells you how likely it is that the event will occur
12.7 Theoretical and Experimental Probability • Theoretical Probability • Complement of an Event – consists of all outcomes in the sample space that are not in the event
12.8 Probability of Compound Events • Pg. 776 – 782 • Obj: Learn how to find probabilities of mutually exclusive, inclusive, independent, and dependent events. • Content Standards: S.CP.7 and S.CP.8
12.8 Probability of Compound Events • Compound Event – consists of two or more events linked by the word “and” or the word “or” • Mutually Exclusive Events • P(A or B) = P(A) + P(B) • Inclusive or Overlapping Events • P(A or B) = P(A) + P(B) – P(A and B) • Independent Events • P(A and B) = P(A) ∙ P(B)
12.8 Probability of Compound Events • Dependent Events • P(A then B) = P(A) ∙ P(B after A)