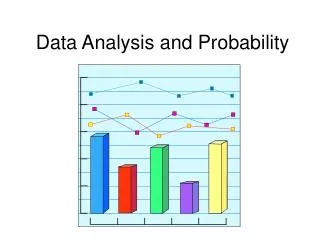
Understanding Data Analysis: Frequency Tables, Box Plots, and Probability Concepts
This chapter explores data analysis techniques and probability fundamentals, starting with constructing frequency tables and line plots from survey data. It further introduces box-and-whisker plots, teaching how to find medians, quartiles, and visualize data distributions. Additionally, the chapter covers theoretical probability through tree diagrams and counting principles, highlighting independent and dependent events in probability. With practical examples in biology and social studies, students learn to apply statistical methods to real-life scenarios, enhancing their data interpretation skills.

Understanding Data Analysis: Frequency Tables, Box Plots, and Probability Concepts
E N D
Presentation Transcript
12-1: Frequency Tables and Line Plots Building a Frequency Table A number cube was rolled 20 times. The results are shown at the right. Display the data in a frequency table.
Surveys Twenty-five students in a school hallway were asked how many books they were carrying. The frequency table at the right shows their responses. Display the data in a line plot. Then find the range. For a line plot, follow steps ,, and .
12-2: Box-and-Whisker Plots Statistics The table, below right, shows United States crops harvested from 1988 to 2000. Make a box-and-whisker plot. Arrange the data in order from least to greatest. Find the median. Find the lower quartile and upper quartile, which are the medians of the lower and upper "halves." Draw a number line. Mark the least and greatest values, the median, and the quartiles. Draw a box from the first to the third quartiles. Mark the median with a vertical segment. Draw whiskers from the box to the least and greatest values.
Biology Use box-and-whisker plots to compare orca whale masses and hippopotamus masses. Orca whale masses (kg) Hippopotamus masses (kg)
Social Studies The plots below compare the percents of the voting-age population who said they registered to vote in U.S. elections to the percents who said they voted. What conclusions can you draw?
12-3: Using Graphs to Persuade Population Which title would be more appropriate for the graph below: "Los Angeles Overwhelms Chicago" or "Populations of Chicago and Los Angeles"? Explain.
Cost of Living Study the graphs below. Which graph gives the impression of a sharper increase in price? Explain.
12-4: Counting Outcomes and Theoretical Probability Drawing a Tree Diagram A school team sells caps in two colors (blue or white), two sizes (child or adult), and two fabrics (cotton or polyester). Draw a tree diagram to find the number of cap choices.
Counting Principle If there are m ways of making one choice, and n ways of making a second choice, then there are m • n ways of making the first choice followed by the second. How many two-letter monograms are possible?
Theoretical Probability Use a tree diagram to find the sample space for tossing two coins. Then find the probability of tossing two tails. Heads Tails
Many people play lottery games without knowing the probability of winning. In some state lotteries, the winning number is made up of four digits chosen at random. Suppose a player buys two tickets with different numbers. What is the probability that the player has a winning ticket? First find the number of possible outcomes. For each digit, there are 10 possible outcomes, 0 through 9.
12-5: Independent and Dependent Events Probability of Independent Events For two independent events A and B, the probability of both events occurring is the product of the probabilities of each event occurring. P(A, then B) = P(A) • P(B) Finding Probability for Independent Events You roll a number cube once. Then you roll it again. What is the probability that you get 2 on the first roll and a number greater than 4 on the second roll?
Botany Under the best conditions, a wild bluebonnet seed has a 20% probability of growing. If you select two seeds at random, what is the probability that both will grow, under the best conditions?
Probability of Dependent Events For two dependent events A and B, the probability of both events occurring is the product of the probability of the first event and the probability that, after the first event, the second event occurs. P(A, then B) = P(A) • P(B after A) Finding Probability for Dependent Events Three girls and two boys volunteer to represent their class at a school assembly. The teacher selects one name and then another from a bag containing the five students' names. What is the probability that both representatives will be girls?
12-6: Permutations and Combinations Find the number of permutations possible for the letters O, P, S, and T. Permutation Notation The expression nPr stands for the number of permutations of n objects chosen r at a time. You have 9 books and want to display 5 on a shelf. How many different 5-book arrangements are possible?
Geography In how many ways could you choose two countries from the table when you write reports about inland water? Make an organized list of all the combinations. Combination Notation The expression nCr stands for the number of combinations of n objects chosen r at a time.
You have five choices of sandwich fillings. How many different sandwiches could you make by choosing three of the five fillings?
Tell which type of arrangement each problem involves. Explain. How many different groups of three books could you choose from five books? In how many different orders could you play three CDs?
12-7: Experimental Probability Medical Science A medical study tests a new medicine on 3,500 people. It is effective for 3,010 people. Find the experimental probability that the medicine is effective.
Simulate the correct guessing of true-false answers. Toss a coin to simulate each guess. Heads represents a correct guess. Here are the results of 50 trials:
12-8: Random Samples and Surveys A population is a group about which you want information. A sample is a part of the population you use to make estimates about the population. For a random sample each member of the population has an equal chance to be selected. Recycling You want to find out whether students will participate if you start a recycling program at your school. Tell whether each survey plan describes a good sample. Interview every tenth teenager you see at a mall. Interview the students in your ecology class. Interview every tenth student leaving a school assembly.
Quality Control From 20,000 calculators produced, a manufacturer takes a random sample of 500 calculators. The sample has 3 defective calculators. Estimate the total number of defective calculators. =