Download
1 / 12
120 likes | 202 Views
Learn how to calculate required sample sizes for estimating means and proportions with specific confidence levels and error margins.

E N D
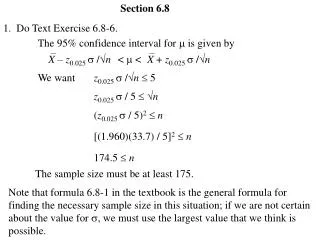
Section 6.8 1. Do Text Exercise 6.8-6. The 95% confidence interval for is given by < < X – z0.025 /n X + z0.025 /n We want z0.025 /n 5 z0.025 / 5 n (z0.025 / 5)2 n [(1.960)(33.7) / 5]2 n 174.5 n The sample size must be at least 175. Note that formula 6.8-1 in the textbook is the general formula for finding the necessary sample size in this situation; if we are not certain about the value for , we must use the largest value that we think is possible.
2. Do Text Exercise 6.8-12. The 90% confidence interval for p is given by < p < Y/n – z/2 (Y/n)(1 – Y/n) / n Y/n + z/2 (Y/n)(1 – Y/n) / n < p < p – z0.05 p(1 – p) / n p + z0.05 p(1 – p) / n We want z0.05 p(1 – p) / n 0.03 z0.05 p(1 – p) / n 0.03 z0.05 p(1 – p) / 0.03 n z20.05 p(1 – p) / (0.03)2 n (1.645)2 p(1 – p) / 0.0009 n 2.-continued The largest possible value for p(1 – p) is when p = 0.5. If we have no information at all about p, then we can use p = 0.5, and this gives us the sample size for the “worst case.” Otherwise we can use a value for p which is as close to 0.5 as seems reasonable.
(1.645)2 p(1 – p) / 0.0009 n Suppose we make no assumption about p, and use p = 0.5 to get the sample size for this “worst case.” Suppose we believe that p is no closer to 0.5 than p = 0.8. (1.645)2 (0.25) / 0.0009 n (1.645)2 (0.8)(0.2) / 0.0009 n 751.7 n 481.1 n The sample size must be at least 752. The sample size must be at least 482. Note that formulas 6.8-2 and 6.8-3 in the textbook are the general formulas for finding the necessary sample size in a situation of either one of these types.
3. (a) An urn contains 1500 marbles, each of which is either green or blue. Let M represent the number of blue marbles, and let p represent the proportion of blue marbles, that is, p = M / 1500. For n < 1500, we define following random variables: X = Y = the number of blue marbles when n marbles are selected with replacement from the urn, the number of blue marbles when n marbles are selected without replacement from the urn. Name the type of distribution X has, and find the mean and variance of X. X has a distribution. b(n, p) M np = n—— 1500 M 1500 – M np(1 – p) = n—— ———— 1500 1500 E(X) = Var(X) =
3.-continued (b) (c) Name the type of distribution Y has, and find the mean and variance of Y. Y has a distribution hypergeometric with N = , N1 = 1500 M. M n —— = np 1500 M 1500 – M 1500 – n n—— ———— ———— = 1500 1500 1500 – 1 E(Y) = Var(Y) = 1500 – n np(1 – p) ———— 1499 Let pX = X / n , and let pY = Y / n . Find the mean and variance for each of pX and pY , explain why each is an unbiased estimator of p = M / 1500, and decide which estimator is better. 1 — E(X) = n 1 — np = p n E(pX) = E(X / n) =
1 — E(X) = n 1 — np = p n E(pX) = E(X / n) = 1 — E(Y) = n 1 — np = p n E(pY) = E(Y / n) = Consequently, both estimators of p are unbiased. 1 — Var(X) = n2 1 p (1 – p) — np (1 – p) = ——— n2n Var(pX) = Var(X / n) = 1 1500 – n — np (1 – p) ———— = n2 1499 1 — Var(Y) = n2 Var(pY) = Var(Y / n) = p (1 – p) 1500 – n ———— ———— n 1499 pY is the better estimator, since its variance is smaller.
3.-continued (d) Suppose a 99% confidence interval for p is to be obtained from a random sample of n observations of X. Find the sample size required if we want the maximum error of estimate to be 0.015. The 99% confidence interval for p is given by < p < p – z0.005 p(1 – p) / n p + z0.005 p(1 – p) / n We want z0.005 p(1 – p) / n 0.015 z20.005 p(1 – p) / (0.015)2 n (2.576)2 p(1 – p) / 0.000225 n Since we make no assumption about p, we use p = 0.5 to get the sample size for this “worst case.” (2.576)2 (0.25) / 0.000225 n 7373.1 n The sample size must be at least 7374.
3.-continued (e) Suppose a 99% confidence interval for p is to be obtained from a random sample of n observations of Yby using the confidence interval discussed just before Example 6.8-4 in the text. Find the sample size required if we want the maximum error of estimate to be 0.015. The 99% confidence interval for p is given on page 391 of the text. We want m ———————— n 1 + (m – 1) / 1500 where m = z20.005 p(1 – p) / (0.015)2 Since we make no assumption about p, we use p = 0.5 to get the sample size for this “worst case.” m = (2.576)2 (0.25) / 0.000225 = 7373.084 1246.6 n The sample size must be at least 1247.
4. (a) Add a worksheet to the Excel file Confidence_Intervals (created previously) which displays the minimum sample size required to estimate a mean or a proportion p. Create a worksheet named Sample Size in the Excel file named Confidence_Intervals as follows:
(1) Insert a new worksheet (using main menu options Insert > Worksheeet), and name the worksheet Sample Size. (2) Enter the labels displayed in columns A and B, and enter the value 0.5 in cell A13 as displayed. (3) (4) (5) Color the cells A2, A3, A4, A12, A13, A14, and A19 with a light color such as yellow. Center the display in cells A2:A5, A7, A12:A15, A17, A19, and A21. From the main menu, use the options Insert > Name > Define to assign the name em to cell A2, the name sb to cell A3, the name zm to cell A5, the name ep to cell A12, the name pb to cell A13, the name zp to cell A15, the name m to cell A17, the name Np to cell A19. (6) Enter the following formulas respectively in cells A5 and A15: =IF(ISBLANK(A4),"-",NORMINV(1-0.5*(1-A4),0,1)) =IF(ISBLANK(A14),"-",NORMINV(1-0.5*(1-A14),0,1))
4.-continued (7) Enter the following formulas respectively in cells A7 and A17: =IF(OR(ISBLANK(A2),ISBLANK(A3),ISBLANK(A4)),"-",ROUNDUP((zm*sb/em)^2,0)) =IF(OR(ISBLANK(A12),ISBLANK(A13),ISBLANK(A14)), "-",ROUNDUP(zp^2*pb*(1-pb)/ep^2,0)) (8) Enter the following formula in cell A21: =IF(OR(ISBLANK(A12),ISBLANK(A13),ISBLANK(A14),ISBLANK(A19)), "-",ROUNDUP(m/(1+(m-1)/Np),0)) (9) Save the file as Confidence_Intervals (in your personal folder on the college network).
(b) (c) (d) (e) Use the Excel file Confidence_Intervals to obtain the sample size in Class Exercise #1 of this section (Text Exercise 6.8-6). Use the Excel file Confidence_Intervals to obtain the sample size in Class Exercise #2 of this section (Text Exercise 6.8-12). Use the Excel file Confidence_Intervals to obtain the sample size in Class Exercise #3(d). Use the Excel file Confidence_Intervals to obtain the sample size in Class Exercise #3(e).