Bioconcentration and Degradation of MCPA in Soil with Earthworm Influence
This study investigates the bioconcentration of MCPA (4-chloro-2-methylphenoxyacetic acid) in soil columns, comparing conditions with and without earthworms. Figures illustrate MCPA accumulation in earthworms, the soil's degrading capacity across depths, and CO2 recovery during six months of incubation. Results highlight the role of earthworms in enhancing MCPA degradation, indicated by varied gene diversity in soil and gut microbial communities. The findings are relevant for understanding soil remediation processes involving earthworms in contaminated environments.

Bioconcentration and Degradation of MCPA in Soil with Earthworm Influence
E N D
Presentation Transcript
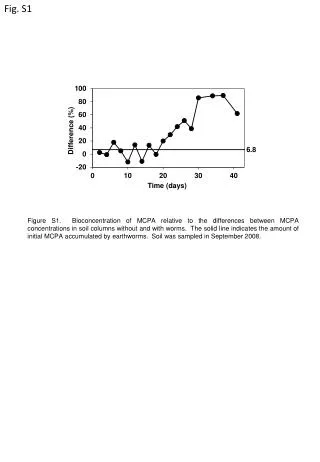
Fig. S1 6.8 Figure S1. Bioconcentration of MCPA relative to the differences between MCPA concentrations in soil columns without and with worms. The solid line indicates the amount of initial MCPA accumulated by earthworms. Soil was sampled in September 2008.
Fig. S2 A MCPA (mM) B Time (days) Figure S2. Effect of earthworm treatment on the capacity of soil from 0-5 cm (A) and 5-10 cm (B) depth of soil columns to degrade MCPA after 37 days of incubation. Oxic microcosms contained soil that had been treated without MCPA in the presence (●) or absence (○) of earthworms. Error bars represent standard deviations of 3 replicates.
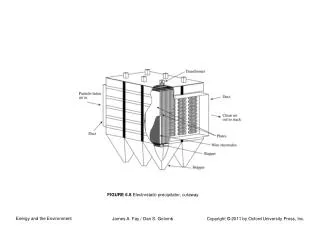
Fig. S3 Potential CO2 NaOH-extracted Non-NaOH extractable Figure S3. Recovery of initial MCPA-14C in NaOH extracts and extracted material (i.e., non-NaOH extrable residues) after 6 months of oxic incubation in microcosms. Potential CO2 was calculated as the Initial MCPA-14C minus 14C recovered in NaOH extracts and extracted material. Bars represent means of duplicate incubations.
Fig. S4 MCPA (mM) Time (days) Figure S4. Capacity of gut contents (●), burrow walls (○), 0-5 cm (■) and 5-10 cm (□) depth bulk soil to degrade MCPA. Oxic microcosms contained soil that had been treated with MCPA in the presence of earthworms in soil columns (Fig. 2A). Error bars represent standard deviations of 3 replicates.
Day 0 Soil Day 42 Gut Fig. S5 Day 22 Day 42 + - + - S A 321, Group 2 227, Group 2 155, Group 4 32, Group 2, Group 1 Class I B 314, Group 2 172-175, Group 2
Day 0 Soil Day 42 Gut Fig. S5 (continued) Day 22 Day 42 + - + - S C 95, Group 3 D 187, Group 1 Class II + III, (Group 2) 57, Group 2 Figure S5. Effect of earthworms (Fig. 2B) on the diversity of tfdA-like genes in soil and gut by T-RFLP analysis of soil columns with MCPA. Restriction digests were performed with BsaHI (A), MefI, PmlI, and FspI (triple digest, B), NsiI (C), or StuI and XcmI (double digest, D) . Soil was sampled in June 2008. Numbers on the left indicate DNA fragment length in bp of a standard (S). +, soil with earthworms, -, soil without earthworms. T-RFs at 360 bp indicate non-digested gene fragments. Black arrows indicate T-RFs assigned to tfdA-like gene sequences in sillico, red boxes indicate unassigned T-RFs, and the blue box indicates incubation-time related T-RFs.