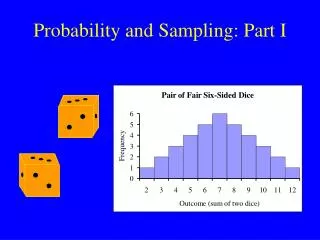

Probability Sampling
E N D
Presentation Transcript
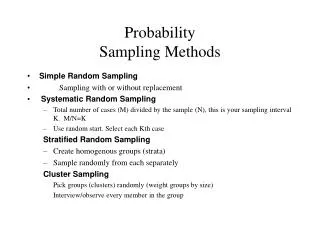
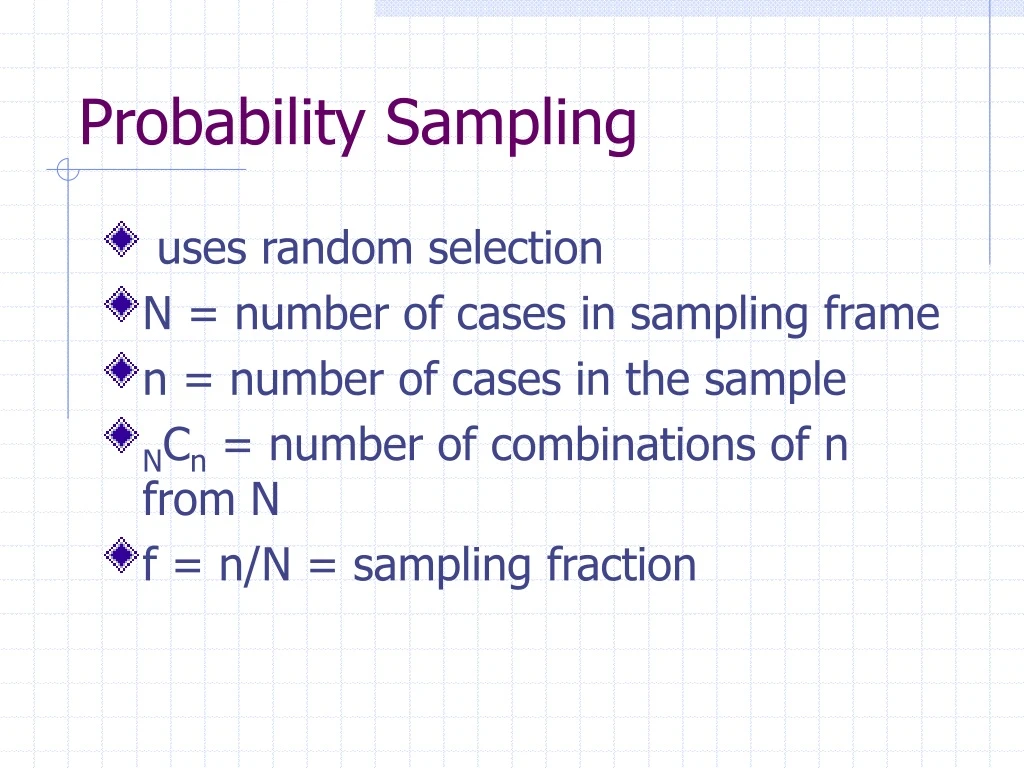
Probability Sampling • uses random selection • N = number of cases in sampling frame • n = number of cases in the sample • NCn = number of combinations of n from N • f = n/N = sampling fraction
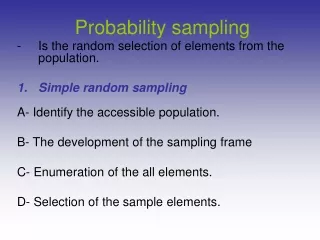
Variations • Simple random sampling • based on random number generation • Stratified random sampling • divide pop into homogenous subgroups, then simple random sample w/in • Systematic random sampling • select every kth individual (k = N/n) • Cluster (area) random sampling • randomly select clusters, sample all units w/in cluster • Multistage sampling • combination of methods
Non-probability sampling • accidental, haphazard, convenience sampling ... • may or may not represent the population well
Measurement • ... topics in measurement that we don’t have time to cover ...
Research Design • Elements: • Samples/Groups • Measures • Treatments/Programs • Methods of Assignment • Time
Internal validity • the approximate truth about inferences regarding cause-effect (causal) relationships • can observed changes be attributed to the program or intervention and NOT to other possible causes (alternative explanations)?
Establishing a Cause-Effect Relationship • Temporal precedence • Covariation of cause and effect • if x then y; if not x then not y • if more x then more y; if less x then less y • No plausible alternative explanations
Single Group Example • Single group designs: • Administer treatment -> measure outcome X -> O • assumes baseline of “0” • Measure baseline -> treat -> measure outcome 0 X -> O • measures change over baseline
Single Group Threats • History threat • a historical event occurs to cause the outcome • Maturation threat • maturation of individual causes the outcome • Testing threat • act of taking the pretest affects the outcome • Instrumentation threat • difference in test from pretest to posttest affects the outcome • Mortality threat • do “drop-outs” occur differentially or randomly across the sample? • Regression threat • statistical phenomenon, nonrandom sample from population and two imperfectly correlated measures
Addressing these threats • control group + treatment group • both control and treatment groups would experience same history and maturation threats, have same testing and instrumentation issues, similar rates of mortality and regression to the mean
Multiple-group design • at least two groups • typically: • before-after measurement • treatment group + control group • treatment A group + treatment B group
Multiple-Group Threats • internal validity issue: • degree to which groups are comparable before the study • “selection bias” or “selection threat”
Multiple-Group Threats • Selection-History Threat • an event occurs between pretest and posttest that groups experience differently • Selection-Maturation Threat • results from differential rates of normal growth between pretest and posttest for the groups • Selection-Testing Threat • effect of taking pretest differentially affects posttest outcome of groups • Selection-Instrumentation Threat • test changes differently for the two groups • Selection-Mortality Threat • differential nonrandom dropout between pretest and posttest • Selection-Regression Threat • different rates of regression to the mean in the two groups (if one is more extreme on the pretest than the other)
Social Interaction Threats • Problem: • social pressures in research context can lead to posttest differences that are not directly caused by the treatment • Solution: • isolate the groups • Problem: in many research contexts, hard to randomly assign and then isolate
Types of Social Interaction Threats • Diffusion or Imitation of Treatment • control group learns about/imitates experience of treatment group, decreasing difference in measured effect • Compensatory Rivalry • control group tries to compete w/treatment group, works harder, decreasing difference in measured effect • Resentful Demoralization • control group discouraged or angry, exaggerates measured effect • Compensatory Equalization of Treatment • control group compensated in other ways, decreasing measured effect
Intro to Design/ Design Notation • Observations or Measures • Treatments or Programs • Groups • Assignment to Group • Time
Observations/Measure • Notation: ‘O’ • Examples: • Body weight • Time to complete • Number of correct response • Multiple measures: O1, O2, …
Treatments or Programs • Notation: ‘X’ • Use of medication • Use of visualization • Use of audio feedback • Etc. • Sometimes see X+, X-
Groups • Each group is assigned a line in the design notation
Assignment to Group • R = random • N = non-equivalent groups • C = assignment by cutoff
Time • Moves from left to right in diagram
Types of experiments • True experiment – random assignment to groups • Quasi experiment – no random assignment, but has a control group or multiple measures • Non-experiment – no random assignment, no control, no multiple measures
Design Notation Example Pretest-posttest treatment versus comparison group randomized experimental design
Design Notation Example Pretest-posttest Non-Equivalent Groups Quasi-experiment
Design Notation Example Posttest Only Non-experiment
Goals of design .. • Goal:to be able to show causality • First step: internal validity: • If x, then y AND • If not X, then not Y
Two-group Designs • Two-group, posttest only, randomized experiment Compare by testing for differences between means of groups, using t-test or one-way Analysis of Variance(ANOVA) Note: 2 groups, post-only measure, two distributions each with mean and variance, statistical (non-chance) difference between groups
To analyze … • What do we mean by a difference?
Three ways to estimate effect • Independent t-test • One-way Analysis of Variance (ANOVA) • Regression Analysis (most general) • equivalent
Regression Analysis Solve overdetermined system of equations for β0 and β1, while minimizing sum of e-terms
ANOVA • Compares differences within group to differences between groups • For 2 populations, 1 treatment, same as t-test • Statistic used is F value, same as square of t-value from t-test
Other Experimental Designs • Signal enhancers • Factorial designs • Noise reducers • Covariance designs • Blocking designs
Factorial Design • Factor – major independent variable • Setting, time_on_task • Level – subdivision of a factor • Setting= in_class, pull-out • Time_on_task = 1 hour, 4 hours
Factorial Design • Design notation as shown • 2x2 factorial design (2 levels of one factor X 2 levels of second factor)
Outcomes of Factorial Design Experiments • Null case • Main effect • Interaction Effect
Statistical Methods for Factorial Design • Regression Analysis • ANOVA
ANOVA • Analysis of variance – tests hypotheses about differences between two or more means • Could do pairwise comparison using t-tests, but can lead to true hypothesis being rejected (Type I error) (higher probability than with ANOVA)