Download
1 / 43
430 likes | 443 Views
This article discusses the innovative gamma-ray tracking technique for building high-resolution Ge spectrometers. Compton scattering and photo-electric effects are key processes involved. Position-sensitive Ge detectors with mm resolution are crucial for accurate tracking. Limitations in position resolution stem from Compton profile due to electron momentum. Methods for gamma-ray tracking involve identifying interaction points and reconstructing tracks using pulse shape analysis. Highly segmented HPGe detectors, digital electronics, and pulse shape analysis algorithms play a crucial role. The AGATA prototype demonstrates effective lateral segmentation optimizing depth sensitivity for ge detectors. The energy resolution of the 36 segments is promising at various energy levels. Ongoing research efforts globally, including AGATA in Europe and GRETA in the US, highlight the continuous advancement in gamma-ray tracking technology.

E N D
AGATA“Gamma-ray tracking”A novel technique for building high-resolution Ge spectrometers Wolfram KORTEN DAPNIA/SPhN
Compton What is gamma-ray tracking ? Physical Processes for photons (in Ge) Compton scattering sequence with final photo-electric effect photo- electric e+e- Need probabilistic approach to determine interaction sequence (e1, 1, e2, 2,…) from Compton scattering relationship: cos(i) = 1 – mec2 (1/Ei – 1/E(i-1)) • Photo-electric effect for energies below 100 keV • Compton scattering is the dominant process • for the energy range 100 keV – 10 MeV • e+e- pair creationstrong only above 10 MeV Position-sensitive Ge detectors with mm resolution Wolfram KORTEN DAPNIA/SPhN
Position sensitive Ge detectors • Position information of the charge flow from preamplifier pulse-shapes : • charge collection time (“rise time”) radial distance • asymmetry of transient signals (mirror charges) azimuth & depth • position determination in 3 dimensions possible withDx=Dy=Dz ~ 1 mm Closed-end coaxial Ge detector with segmented outer electrode Wolfram KORTEN DAPNIA/SPhN
Eg’ Eg = 300 keV GEANT electron unbound and at rest GLECS complete simulation 0º 180º 180º 0º scattering angle scattering angle What limits the position resolution ? Principal limitation:Compton profile due to electron momentum Position resolution of each interaction limitedD(x,y,z) ~ 1mm GLECS: Geant3 Low-Energy Compton Scatteringby R. Marc Kippen www.batse.msfc.nasa.gov/actsim Wolfram KORTEN DAPNIA/SPhN
Tracking of Compton scattering events Source position is known • Questions : • Is the event complete • What is the right sequence Wolfram KORTEN DAPNIA/SPhN
Mg = 30 Expected performance of g-ray tracking algorithms Simulation of a high multiplicity event detected by an ideal shell ~50% correct identification Wolfram KORTEN DAPNIA/SPhN
How to perform g-ray tracking ? 4 1 Identified interaction points Reconstruction of tracks e.g. by evaluation ofpermutations of interaction points Highly segmented HPGe detectors (x,y,z,E,t)i g · · Pulse Shape Analysisto decomposerecorded waves · · 2 3 Digital electronics to record and process segment signals reconstructed g-rays Wolfram KORTEN DAPNIA/SPhN
Highly-segmented HPGe detectors 1.5 kg crystals, hexaconical, encapsulated, 36-pixel cathode Digital electronic to digitise segment signals 100 MHz continuous sampling with 14 bit FADC Calculation/measurement of pulse shapes as a function of position inside the germanium crystal Net and transient signals Pulse Shape Analysis algorithms to decompose pulses into positions and energies Today still a major challenge for real-time operation Reconstruction of “tracks” by likelihood methods Performance depends on quality of PSA Ingredients of a gamma tracking array Worldwide R&D activity of the last ~10 years AGATA in Europe - GRETA in the US Wolfram KORTEN DAPNIA/SPhN
Lateral segmentation optimised for similar “effective” depth AGATA prototype Ge detector • Hexaconical Ge crystals • 90 mm long, 80 mm diameter • 36 segments + centre contact • Aluminum encapsulation • developed for Euroball : • 0.6 mm spacing • 0.8 mm thickness • 37 vacuum feedthroughs • easy handling (no clean room) Wolfram KORTEN DAPNIA/SPhN
Field simulations of AGATA detectors The impact of effective segmentation on closed-end coaxial Ge detectors z [cm] tapering angle = 8° r [cm] geometrical segmentation Wolfram KORTEN DAPNIA/SPhN
z y x 200 0 Position sensitivity from pulse shapes Sensitivity for dx=dy=dz=2mm y total sensitivity a.u. z x Wolfram KORTEN DAPNIA/SPhN
Energy resolution of the 36 segments A003 (INFN) 2.01 keV <FWHM> @1.33 MeV 1.03 keV <FWHM> @ 60 keV Guaranteed FWHM values at 1.33 MeV : < 2.30 keV, mean < 2.1 keV at 60 keV : < 1.35 keV, mean < 1.15 keV Central contact (core) Measured FWHM at 1.33 MeV : 2.13 keV at 122 keV : 1.10 keV Guaranteed FWHM at 1.33 MeV : 2.35 keV at 122 keV : 1.35 keV First measurements on the prototype Hexagonal single-crystal cryostatused for acceptance tests and detector characterisation Wolfram KORTEN DAPNIA/SPhN
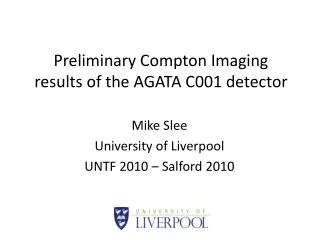
AGATA detector characterisation CSNSM Orsay Three 3D coincidence scanning systems are being developed Liverpool,CSNSM Orsayand GSI Full scan in 1 mm3 grid almost impossible define characteristic points to calibrate calculations Wolfram KORTEN DAPNIA/SPhN
AGATA detector characterisation First data taken in spring 2005 Liverpool coincidence scanning setup with multileaf collimator Wolfram KORTEN DAPNIA/SPhN
Signal rise time maps A2 A3 A1 T30 10 to 30% B2 B3 B1 C2 C3 C1 1 6 2 T90 10 to 90% 5 3 4 F E D C B A Pulse shapes from AGATA detector Interaction position encoded by net charge and transient signals Wolfram KORTEN DAPNIA/SPhN
Results from 1st order PSA g emission from a moving source (v/c~5%) position-dependent Doppler effect Radial position from charge collection time Azimuthal position from mirror-charge asymmetry Wolfram KORTEN DAPNIA/SPhN
AGATA triple-detector module 3 encapsulated Ge crystals in one cryostat 111 preamplifiers with cold FET ~230 vacuum feedthroughs LN2 dewar, 3 litre, cooling power ~8 watts First prototype summer 2005 Detector site planned at DAPNIA from end 2006 Wolfram KORTEN DAPNIA/SPhN
The AGATA conceptual design 180 hexagonal crystals 3 shapes 60 triple-clusters all equal Inner radius (Ge) 23.1 cm Amount of germanium 362 kg Solid angle coverage 82 % 6480 segments Singles rate ~50 kHz Efficiency: 43% (Mg=1) 28% (Mg=30) Peak/Total: 58% (Mg=1) 49% (Mg=30) 6660 high-resolution digital electronics channels & high throughput DAQ Sophisticated Pulse Shape Analysis position sensitive operation mode High performance computing system to decompose in real time Sophisticated g-ray tracking algorithms to achieve maximum efficiency Coupling to ancillary detectors (internal and external) for added selectivity Wolfram KORTEN DAPNIA/SPhN
The AGATA DemonstratorObjective of the final R&D phase 2003-2007 1 symmetric triple-cluster 5 asymmetric triple-clusters 36-fold segmented crystals 540 segments 555 digital-channels Eff. 3 – 8 % @ Mg = 1 Eff. 2 – 4 % @ Mg = 30 Full ACQ with on line PSA and g-ray tracking Operational in 2007 Cost ~ 6 M€ Wolfram KORTEN DAPNIA/SPhN
Electronics and Data Acquisition Prototypes for all subsystems in 2006 Wolfram KORTEN DAPNIA/SPhN
AGATA computing requirements SEGMENT 0.7 Gb/s 100 B/segment 50 Ms/s 14 bits Energy (MWD) Segment using ~20 samples around pulse Local Trigger Time stamped data DETECTOR E, t, x, y, z,... 20 ms/hit Pulse Shape Analysis 6 segments/hit 50 kHz singles (Mg =30, 0.3 M Ev/s) 36+1 segments per detector 0.6 kB/hit 30 MB/s 40 B/hit 2 MB/s GLOBAL 1ms/gamma (1GHz PIII) <100 MB/s Trigger, Storage, On Line Analysis 190 detectors Merge Tracking 400 MB/s ~9000 CPUs Wolfram KORTEN DAPNIA/SPhN
100 MB/s x 180 5 MB/s x 180 1 GB/s 100 MB/s AGATA computing requirements(Ge detectors at 50 kHz, no trigger) Front-end electronics and pre-processing Pulse Shape Analysis ~ 106 SI95 using 10 ms/event/CPU 10000 CPUs 2005 1000 CPUs 2015 Event Builder ~ 104 SI95 100 CPUs 2005 10 CPUs 2015 Tracking ~ 105 SI95 1000 CPUs 2005 100 CPUs 2015 Storage SI95 = SpecInt 95 1 PetaByte/year Wolfram KORTEN DAPNIA/SPhN
Portable g-ray imager, i.e. 235U detection Medical imaging, i.e. of positron sources g-ray astronomy Applications of g-ray tracking Position-sensitive Ge detectors allow imaging the origin of g-ray sources • Advantages of a Germanium-based Compton camera : • excellent energy resolution (~ keVvs. tenth of keV) • very good position resolution (~ mm vs. cm) • high efficiency (no coincidences needed) Wolfram KORTEN DAPNIA/SPhN
q 2 20 200 FWHM ~8° 2000 f sin q q Imaging of g-rays derived from the overlapping Compton-scattering cones events Wolfram KORTEN DAPNIA/SPhN
Scattered Coincidence Random Coincidence True Coincidence Imaging with Ge detectors • Existing technology relies on BGO scintillator technology. • Limited position resolution. • High patient dose requirement. • Poor energy resolution only accept photopeak events. • Will not function in large magnetic field. • SPECT applications utilising Compton Camera techniques. Wolfram KORTEN DAPNIA/SPhN
The SmartPet project (courtesy of Univ. Liverpool) Imaging using double-sided planar Ge strip detectors Ideal electric-field geometry of planar Ge detectors Wolfram KORTEN DAPNIA/SPhN
SmartPET detector depth response “superpulse” pulse shapes for 137Cs events versus depth AC signals DC signals DC signals AC signals courtesy of . A. Boston Univ. Liverpool
The typical maximum size of an image charge pulse is 15% that of the real charge signal. 241Am pulse response. SmartPET : Image charge response e- courtesy of . A. Boston Univ. Liverpool h
The typical maximum size of an image charge pulse is 15% that of the real charge signal. 241Am pulse response. SmartPET : Image charge response e- courtesy of . A. Boston Univ. Liverpool h
The typical maximum size of an image charge pulse is 15% that of the real charge signal. 241Am pulse response. SmartPET : Image charge response e- courtesy of . A. Boston Univ. Liverpool h
The typical maximum size of an image charge pulse is 15% that of the real charge signal. 241Am pulse response. SmartPET : Image charge response e- courtesy of . A. Boston Univ. Liverpool h
The typical maximum size of an image charge pulse is 15% that of the real charge signal. 241Am pulse response. SmartPET : Image charge response e- courtesy of . A. Boston Univ. Liverpool h
Conclusions • Gamma-ray tracking has become a reality • Ge detectors with (a few) mm position resolution • HP Ge crystals with highly segmented electrode • Fast digitising electronics • Algorithms for (online) pulse shape analysis still being optimised (speed) • Gamma-ray tracking working well (on simulated data) • AGATA demonstration phase with 5 modules • Further (imaging) applications still under investigation • AGATA will be a vital instrument for the next generation Radioactive Beam Facilities (SPIRAL2, FAIR, EURISOL) • New European large-scale infrastructure (ESFRI ?) Wolfram KORTEN DAPNIA/SPhN
Proposals for two 4p arrays AGATA in Europe (Advanced Gamma Tracking Array) GRETA in the US (Gamma Ray Energy Tracking Array) First phase of construction funded: AGATA-Demonstrator with 15 detectors GRETINAwith 30 detectors First prototype detectors just delivered Triple cluster to GRETINA 3 capsules + cryostats to AGATA Electronics at the prototype stage Expected completion of developments by 2007 Full arrays to be funded as instrumentation for next generation of radioactive beam facilities, SPIRAL2/FAIR/Eurisol in the EU and RIA in the US Status and Perspectives of gamma tracking arrays Wolfram KORTEN DAPNIA/SPhN
The AGATA Collaboration status at beginning of 2004 Bulgaria: Sofia Denmark: Copenhagen Finland: Jyväskylä France: GANIL, Lyon, Orsay, Saclay, Strasbourg Germany: Berlin, Bonn, GSI, Darmstadt, Jülich, Köln, München Italy: Padova, Milano, LNL, Firenze, Camerino, Napoli, Genova Poland: Krakow, Swierk, Warsaw Romania: Bucharest Sweden: Lund, Stockholm, Uppsala UK: Daresbury, Brighton, Keele, Liverpool, Manchester, Paisley, Surrey, York New partners: Hungary and Turkey Wolfram KORTEN DAPNIA/SPhN
AGATA Organisation Steering Committee ASC Chair: Marcello Pignanelli 14 representatives of 10 EU countries Management Board AMB PM: John Simpson and the responsibles of the 7 Working Groups J.Eberth R.Krücken D.Bazzacco G.Duchêne A.Gadea J.Nyberg W.Korten Detector Module Local LevelProcessing ConceptualDesign and Global LevelProcessing Design & Infrastructure AncillaryDetectorsand their Integration DataAnalysis EUContact AGATA Working Teams Preamplifiers Detector and cryostat Digitisation Pre-processing algorithms Pre-processing hardware PSA Detectorcharacterisation Conceptual design Gamma-ray tracking Data acquisition hardware Data acquisition software Global clock and trigger Mechanical design Infrastructure R & D other detectors Detectors and devices Impact on performance Electronics and DAQ Mechanical integration Devices for key experiments Exp. simulation Data base Data processing Wolfram KORTEN DAPNIA/SPhN
e h Detector = p-i-n diode -HV Near intrinsic bulk (ND~1010cm-3) Highly doped thin contacts NA ~ 1018cm-3 ND ~ 1018cm-3 B ~ 3 mm Li ~ 0.5 mm Reverse bias (-HV on p+ contact)depletes bulk generates high electric filed Radiation creates carriers in bulk Carriers swept out by field signal
Signal Formation • Signal is due to the motion of charge carriers inside the detector volume. • Calculations based on the weighting field method derived by Ramo’s theorem, which is based on • Green’s reciprocity theorem that says: given two systems consisting of a distribution of charges and electrodes, charges and voltages are related by
VMW= 1 volt QMW VW(P) q=0 Induced Charge VM=0 QM V(P) q Vw dimensionless The charge induced in one of an electrode of the system by a charge q placed in the space in between the electrodes is given by the product of the inducing charge times the potential generated at the position of the charge when the charge itself is removed, the electrode of interest (sensing) is put at V = 1 volt and all other electrodes of the system are put to ground.
Ramo’s theorem The current induced by a moving charge is given by e/h move in opposite direction they induce signals of the same sign Velocity of the inducing charge, as it moves under the influence of the operational electric field obtained solving the Poisson equation for the actual detector. Weighting Field, obtained solving the Laplace equation after removing all charges and grounding all electrodes but the sensing one which is set to V=1 volt.
Pulse shapes in segmented detectors On “true” coax, shape depends on initial radius “net” and “transient” shapes depend on the angular position of the point
· · · · · · · · · · · · · · · · * · · net charge signals transient signals · · · · · · · · Calculation of pulse shapes Calculation of the signals induced on the contacts using the weighting field method FEM-model of detector Calculate weighting fields Th. Kröll, NIM A 463 (2001) 227
1 3 e1 1 e3 2 E2 E1 2 e2 Properties of Compton Scattering source 0 E0 assuming that the e- is at rest, from conservation of energy & momentum: incident energy at i cos(i) = 1 – mec2 (1/Ei – 1/E(i-1)) scattered energy at i = E(i-1)-ei Wolfram KORTEN DAPNIA/SPhN