Download
1 / 20
200 likes | 330 Views
Cost Curves To Master. Pure Competiton Monopoly Oligopoly Monopolistic Competition. Price or Cost (dollars per unit). 0. Quantity (units per period). Maximizing Oligopoly Profits. Industry marginal cost. Industry average cost. Profit- maximizing price. Market demand. Profits.

E N D
Cost Curves To Master Pure Competiton Monopoly Oligopoly Monopolistic Competition
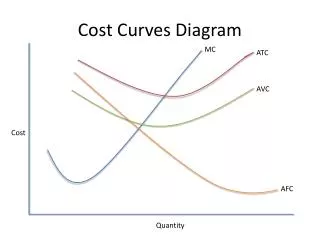
Price or Cost (dollars per unit) 0 Quantity (units per period) Maximizing Oligopoly Profits Industry marginal cost Industry average cost Profit- maximizing price Market demand Profits Average cost at profit- maximizing output J Industry marginal revenue Profit-maximizing output
Price is determinedin the market. Price Price MarketSupply Individual firms musttake the market price. P P Demand forSingle Firm MarketDemand Output / Time Output / Time • The market forces of supply and demand determine price. Price Taker’s Demand Curve • Price takers have no control over the price that they may charge in the market. If such a firm was to offer their good/service at a price above that established by the market they would buy elsewhere.
MC p = MC Profit ATC P d(P = MR) C A P > MC P < MC decrease q Increase q • In the short run, the price taker will expand output until marginal revenue (price) is just equal to marginal cost. Profit Maximization when the Firm is a Price Taker Price • This will maximize the firm’s profits (rectangle BACP). B • When P > MC then the firm can make more on the next unit sold than it costs to increase output for that unit. In order for the firm to maximize its profits it increases output until MC = P. • When P < MC then the firm made less on the last unit sold than it cost for that unit. In order for the firm to maximize its profits it decreases output until MC = P. Output/ Time q 0
Where is pure profit? Normal Profit? • Given Pe, firm produces qe where MC = MR • If AC = AC1, break-even • If AC = AC2, losses • If AC = AC3, economic profit
Diseconomies of scale Constant returns to scale Economies of scale ATC3 ATC1 ATCS ATCS ATCS m3 ATC2 COST (dollars per unit) m1 m2 c c c 0 QM 0 QM 0 QM RATE OF OUTPUT (units per period) RATE OF OUTPUT (units per period) RATE OF OUTPUT (units per period) Economies of Scale
Profit Maximization and Loss Minimization for the Perfectly Competitive Firm: Three Cases I • In Case 1, TR TC and the firm earns profits. • It continues to produce in the short run.
Profit Maximization and Loss Minimization for the Perfectly Competitive Firm: Three Cases II • In Case 2, TR < TC and the firm takes a loss. • It shuts down in the short run because it minimizes its losses by doing so; it is better to lose $400 in fixed costs than to take a loss of $450.
Profit Maximization and Loss Minimization for the Perfectly Competitive Firm: Three Cases III • In Case 3, TR < TC and the firm takes a loss. • It continues to produce in the short run because it minimizes its losses by doing so; it is better to lose $80 by producing than to lose $400 in fixed costs by not producing.
Economic profits with price discrimination MC P ATC MR=D D Q Q1 Q2