Download

1 / 2
30 likes | 154 Views
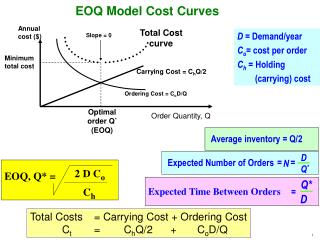
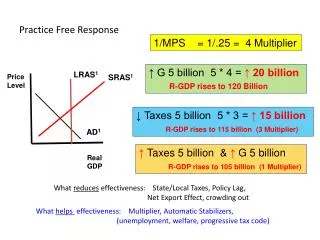
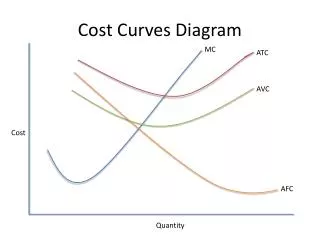
This analysis explores the economic implications of cost curves, including marginal cost (MC), average total cost (ATC), and average variable cost (AVC) in a market scenario. It examines cases of economic profit and loss at varying output levels, specifically highlighting conditions such as decreasing ATC when producing 1 to 3 units, and the strategic implications of fixed costs being sunk. The study also details the impact of market prices on economic outcomes, illustrating profits and losses at different units produced.

E N D
Cost Curves Free Response MC ATC AVC AFC
MC QTY TC MC ATC TVC AVC AFC ATC AVC AFC 2) $20 economic loss (fixed costs are sunk) 1) Yes => 1 to 3 units => ATC decreasing 3) approx. @ 3-4 units (min of ATC) 4) $28 economic profit ($25-$18) X 4 units = $28 4) b. $27 market price 4 units +$36 economic profit ($27-$18) X 4 units = +$36 c. $14 market price 3 units -$9 economic loss ($14-$17) X 3 units = -$9 loss $6 market price 0 units -$20 economic loss fixed costs are sunk! Lose less than opening!