Download
1 / 54
540 likes | 563 Views
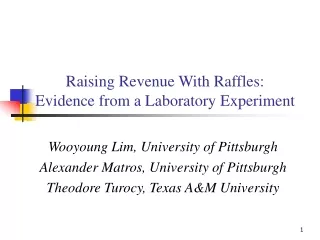
Raising Revenue With Raffles: Evidence from a Laboratory Experiment. Wooyoung Lim, University of Pittsburgh Alexander Matros, University of Pittsburgh Theodore Turocy, Texas A&M University. Lotteries. As of 2008, 43 States have State Lotteries 33% - 50% of USA population participates.

E N D
Raising Revenue With Raffles:Evidence from a Laboratory Experiment Wooyoung Lim, University of Pittsburgh Alexander Matros, University of Pittsburgh Theodore Turocy, Texas A&M University
Lotteries • As of 2008, 43 States have State Lotteries • 33% - 50% of USA population participates
Lotteries A lottery is a salutary instrument and a tax...laid on the willing only, that is to say, on those who can risk the price of a ticket without sensible injury, for the possibility of a higher prize. Thomas Jefferson
Lotteries Too many players buy too many tickets Why?
Literature • (A) Buy Hope? Clotfelter and Cook (1989, 1990, 1993)
Literature • (A) Buy Hope? Clotfelter and Cook (1989, 1990, 1993) • (B) Charity/Fund raising? Morgan (2000), Morgan and Sefton (2000)
Literature • (A) Buy Hope? Clotfelter and Cook (1989, 1990, 1993) • (B) Charity/Fund raising? Morgan (2000), Morgan and Sefton (2000) • What if no (A) and no (B)?
Plan • Theory • Experiments • Data • Behavioral Models • Results • Conclusion
Theory n risk neutral players V – prize value W – endowment xi 0 player i’s expenditure
Players’ maximization problem Player i solves the following problem
Nash equilibrium • Absolute performance • Unique Nash equilibrium!
Evolutionary Stable Strategies • Relative performance (spiteful behavior)
Experimental Design V = 1,000 tokens (= $10) W = 1,200 tokens (= $12) Quizzes Expected payoff tables N = 2, 3, 4, 5, 9 3 sessions for each N Pittsburgh Experimental Economics Laboratory October 2007 – March 2008
Experimental Design Quiz 1 • Assume that your contribution is 100 tokens and your opponent’s contribution is 900 tokens. What is your chance to win the lottery? • 100 / 900 • 100 / 1,000 • 100 / 800 • 800 / 900 • 900 / 1,000 • Assume that your contribution is 900 tokens and your opponent’s contribution is 100 tokens. What is your chance to win the lottery? • 100 / 900 • 100 / 1,000 • 800 / 900 • 900 / 1,000 • 900 / 900
Experimental Design Quiz 2 • Assume that your contribution is 100 tokens and your opponent’s contribution is 900 tokens. What is your expected payoff? • -100 • 0 • 100 • 900 • 1,000 • Assume that your contribution is 900 tokens and your opponent’s contribution is 100 tokens. What is your expected payoff? • - 900 • - 100 • 0 • 100 • 900
Data • Integer multiples of 100 in 78.1% • Integer multiples of 50 in 87.7% (+9.6%)
Behavioral Predictions • Quantal Response Equilibrium • Level – k reasoning • Learning Direction Theory
Quantal Response Equilibrium • McKelvey and Palfrey (1995) • Noisy optimization process • - the best parameter (from the data) • = 0 – all choices are random • = – no noise (QRE Nash)
Level – k reasoning • Stahl and Wilson (1994, 1995) • Level – 0: random • Level – 1: best reply to Level – 0 • Level – 2: best reply to Level – 1
Level – k reasoning • Ho, Camerer and Weigelt (1998) • Level – 0: uniform on [0, V] – density B0 • Level – 1: simulate N-1 draws from B0 compute best reply • Level – 2:
Level – k reasoning • Level – 0 in N • Level – 1 in N • Costa-Gomes and Crawford (2004) classify subjects: at least 6 out of 10 96% can be classified! • Iterated elimination of dominated strategies: No
Learning Direction Theory • Selten and Buchta (1994) • “Subjects are more likely to change their past actions in the directions of a best response to the others’ previous period actions.”
Learning Direction Theory • If you lose, you change “Small lotteries” Yes Other lotteries No • If you win: you overpaid; if you lose: you underpaid “Small lotteries” Yes Other lotteries No • Adjust in the best reply direction “Small lotteries” Yes Other lotteries No
Conclusion Subjects’ behavior in lotteries w/t (A) and (B) a) Nash equilibrium b) ESS c) QRE d) Level – k reasoning e) Leaning direction theory
Conclusion Data a) “Almost” do not change to change in N b) Overspending even for N = 4, 5, 9
Conclusion Data: N = 2 a) Nash c) QRE (the least noise) d) Level – k reasoning (Level – 1) e) Leaning direction theory (BR changes)
Conclusion Data: N = 3 b) SSE c) QRE (noise) d) Level – k reasoning (Level – 1) e) Leaning direction theory (some BR changes)