Regression and Correlation
Explore the concepts of regression and correlation, distinguish causality from correlation, and analyze methods in Excel for calculating R-squared and creating trendlines. Understand the difference between regression and correlation in data analysis.

Regression and Correlation
E N D
Presentation Transcript
Regression and Correlation Module 8 module 8
Relationship between two variables • Changing wind speed, humidity, or other met parameters, and • Pollutant concentrations module 8
Causality? • Simultaneous change does not imply causality • seat belt use on airplanes • ADHD rate among children and the number of child therapists in the U.S. • Snoring and sleeping with someone else in your bedroom • Other factors may be root cause of both, or may be an “artifact” of your data module 8
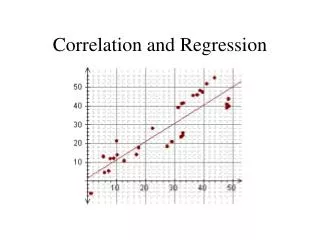
Linear regression: • Y=mx + b • The difference between the real y values and the predicted-based-on-a-straight-line y values is • “Residual” • This is used to calculate R squared • R squared is a measure of the difference between a perfect line and your data module 8
methods in Excel: • Create an XY chart • With chart selected, click on Chart, Add Trendline module 8
Within the chart method, cont: • Click on Options, • Display equation and R2 on chart, • can also create a regression line based on nonlinear correlation module 8
Excel method: • Use functions • =slope( Ys FIRST, Xs) • =intercept (Ys, Xs) • =steyx (Ys, Xs) • =forecast (Ys, Xs) module 8
method in Excel: • Data Analysis Toolpak • Regression • Advantages: creates a normal probability plot, if you select this option • Creates a tabled output (be careful do not write over data) module 8
R squared: • from to • how closely the estimated values for the trendline correspond to your actual data • trendline is most reliable when its R-squared value is at or near Also known as the coefficient of determination module 8
Regression vs Correlation: • Regression based on how far Ys differ from their predicted values • Regression looks at the variability in X and uses it to predict variability in Y • Correlation (aka Pearson correlation coefficient) evaluates the proportion of the y-change that is DUE to the x-y relationship • RSQ(known_y's,known_x's) module 8
Correlation: • Three excel methods: • = RSQ (Ys, Xs) • = CORREL (array) • = PEARSON (array) • Cautions: must arrange data first to use array • Check if R or R2 value is returned module 8