CalNex 2010 - NOAA Twin Otter
240 likes | 353 Views
Airborne lidar measurements of horizontal and vertical ozone transport in southern California during CalNex 2010. C. J. Senff , R. J. Alvarez II, R. M. Hardesty, A. O. Langford, R. M. Banta, W. A. Brewer, F. Davies, S. P. Sandberg, R. D. Marchbanks , A. M. Weickmann

CalNex 2010 - NOAA Twin Otter
E N D
Presentation Transcript
Airborne lidar measurements of horizontal and vertical ozone transport in southern California during CalNex 2010 C. J. Senff, R. J. Alvarez II, R. M. Hardesty, A. O. Langford, R. M. Banta, W. A. Brewer, F. Davies, S. P. Sandberg, R. D. Marchbanks, A. M. Weickmann CalNex Data Analysis Workshop 18 May 2011
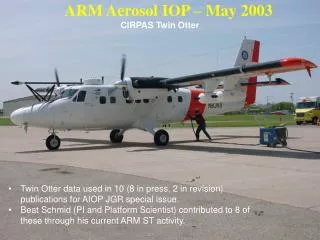
CalNex 2010 - NOAA Twin Otter • Optical remote sensing aircraft • 19 May – 19 July, 2010 • 52 flights, 207 flight hours • Twin Otter CalNex operating parameters: • Speed: ~ 60 m s-1 • Endurance: up to 4 hours • Flight altitude: 500 - 17500 ft MSL Sacramento 15 – 28 June Ontario 19 May – 14 June 29 June – 19 July
NOAA Twin Otter Instrumentation Primary instruments: Downward-looking ozone and aerosol lidar (TOPAZ = Tunable Optical Profiler for Aerosols and oZone) University of Leeds scanning Doppler wind lidar Airborne Multi-Axes Differential Optical Absorption Spectroscopy (AMAX-DOAS) Instrument (R. Volkamer et al, CU Boulder) Additional instruments: In situ O3, temperature, pressure Radiometers (surface temp, albedo)
TOPAZ Lidar (19 May – 19 July) • Ozone & aerosol backscatter profiles • Min / Max Range: 400 m / 3 – 5 km • Resolution (O3): Δx = 600 m, Δz = 90 m
12.5 deg off nadir Track U of Leeds Doppler lidar (7 June – 18 July) • Horizontal wind speed and direction profiles • Vertical wind speed profiles • Min / Max Range: 50 m / up to 3 km • Resolution: Δx = 500 – 800 m, Δz = 50 m
NOAA Twin Otter CalNex Science Objectives Distribution of pollutants 3-dimensional distribution of ozone and aerosols over different regions of California Horizontal transport Flow of ozone and aerosol between different air basins in California Import and export of ozone into/out of California Vertical transport Topographic forcing (Mountain Chimney effect) Boundary layer detrainment Ozone layers aloft Stratospheric intrusions (Andy Langford, talk) Pollution layers transported from Asia (Andy Langford, poster) Air Quality model validation Synergies between AMAX-DOAS and LIDAR Constrain Ox budget (Ox = NO2 + O3)
Regional Pollution in Southern California California Area Designations for 8-hour Ozone NAAQS
Pollution export pathways fromthe L A Basin Mojave Desert Cajon Pass Newhall Pass San Gabriel Mtns San Bernardino Mtns Banning Pass Land-Sea breeze Mountain Chimney Effect
Daily maximum 8-hour surface O3 concentration Southern California: May 19 – July 19 Highest 8-h O3 value in CA in 2010
Daily maximum 8-h O3 concentration averaged for 5 June, 23 June, and 17 July 2010
NOAA Twin Otter CalNexflights in Southern California 2 July 2010
2 July 2010: O3 distribution over L A Basin and Mojave Desert FL 11500 – 13500 MSL 14:06 – 17:47 PST
2 July 2010: Transport thru Banning Pass and along/over San Gabriel Mtns
2 July 2010: Transport thru Banning Pass Combination of lidar remote ozone and wind measurements allows to quantify horizontal ozone flux
2 July 2010 • Upslope transport along/over the San Gabriel Mtns • Transport into Mojave Desert via Newhall Pass
2 July 2010: Transport to Western Mojave Desert via Newhall Pass / Santa Clarita Lancaster Soledad Canyon
2 July 2010: Transport thru Banning Pass Ozone, ppbv Horizontal wind speed , m/s
FLEXPART trajectories 01UT 3 July 2010 (3 km MSL)(Jerome Brioude)
Pre-CalNex: 17 July 2009 HYSPLIT forward trajectories Langfordet al, 2010: Long-range transport of ozone from the Los Angeles Basin: A case study, Geophys. Res. Lett., doi:10.1029/2010GL042507.
Summary & Outlook • Characterized ozone export processes from the L A Basin using airborne lidar and surface ozone data • Demonstrated capability to remotely measure ozone and horizontal wind speed/direction from an airborne platform • Next steps: • Retrieve fluxes and quantify ozone transport • Expand analysis to include other regions in CA
Acknowledgement R. J. Alvarez, R. M. Hardesty, A. O. Langford, R. M. Banta, W. A. Brewer, F. Davies, S. P. Sandberg, R. D. Marchbanks, A. M. Weickmann, J. G. George NOAA Twin Otter flight crews & NOAA Aircraft Operations Center NOAA Health of the Atmosphere Program
Correlation between daily max. 8-h surface O3 within and outside of South Coast Air Basin (SC) for 5/19 – 7/19/2010
Correlation between daily max. 8-h surf. O3 at Mojaveand Southern San Joaquin Valley (SSJV) or SC for 5/19 – 7/19/2010