Download
1 / 20
200 likes | 221 Views
Learn how supply and demand interact to create market equilibrium, the impacts of excess demand and supply, and how shifts in supply and demand affect market prices. Explore the role of prices in guiding market activity and the advantages they offer in resource allocation.

E N D
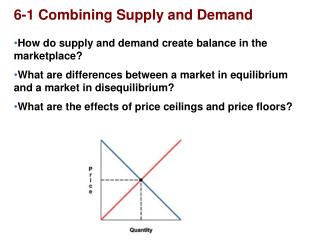
Combining Supply and Demand • How do supply and demand create balance in the marketplace? • What are differences between a market in equilibrium and a market in disequilibrium?
1st… another shameless commercial It’s a donut SALE abration ! only.50 ea hurry while they last! mmmm….crap to eat
1. Excess Demand occurs when quantity demanded is more than quantity supplied Ex: Renner sells doughnuts @ .50 ea Market Disequilibrium Markets are often in a state of “disequilibrium” There are two causes:
New and Improved $2.00 ea Hurry! Won’t Last… “Down-home country goodness baked into each & every bite” New Shipment Just Arrived ! DONUTS
Market Disequilibrium 2. Excess Supply occurs when quantity supplied exceeds quantity demanded Ex: Renner sells doughnuts @ $2.00 ea
The point at which quantity demanded and quantity supplied come together is known as equilibrium. Finding Equilibrium Equilibrium Point Combined Supply and Demand Schedule $3.50 $3.00 $2.50 $2.00 $1.50 $1.00 $.50 Price of a donut Quantity demanded Quantity supplied Result $ .50 300 100 Shortage from excess demand Price per donut a Equilibrium Price $1.00 250 150 $1.50 200 200 Equilibrium Equilibrium Quantity $2.00 150 250 Supply Demand Surplus from excess supply $2.50 100 300 0 50 100 150 200 250 300 350 350 $3.00 50 Quantity of Donuts Balancing the Market
Sec. 2 Changes in Market Equilibrium • How do shifts in supply affect market equilibrium? • How do shifts in demand affect market equilibrium? • How can we use supply and demand curves to analyze changes in market equilibrium?
Shifts in Demand • Excess Demand creates a “shortage” • A shortage is a situation in which quantity demanded is greater than quantity supplied • Suppliers react by: • Raising prices…possibly increasing supply • A Decline in Demand itself • Because of a change in market conditions such as: • customer preferences (tastes) • population • income • When demand falls, suppliers respond by cutting prices, and a new market equilibrium is found.
Shifts in Supply • Understanding a Shift • A change in supply will lead the market to a new equilibrium price and quantity sold. • Excess Supply: “surplus” • If a surplus occurs, producers reduce prices to sell their products, and possibly decrease supply. This creates a new market equilibrium. • A Fall in Supply • The opposite occurs: As supply decreases, producers will raise prices and demand will decrease.
Graph A shows how the market finds a new equilibrium when there is an increase in supply (examples) Graph A: A Change in Supply Graph B: A Change in Demand $800 $600 $400 $200 0 $60 $50 $40 $30 $20 $10 Supply a b Original supply c c Price Price a b New demand New supply Demand Original demand 0 1 2 3 4 5 100 200 300 400 500 600 700 800 900 Output (in millions) Output (in thousands) Analyzing Shifts in Supply and Demand • Graph B shows how the market finds a new equilibrium when there is an increase in demand (examples)
Declining Supply Raises Prices Graph C shows how the market finds a new equilibrium when there is an decrease in supply. Graph C: A Decrease in Supply = Higher Prices $800 $600 $400 $200 0 a b New supply c Price Original supply Demand 1 2 3 4 5 Output (in millions)
Supply and Demand: Equilibrium Equilibrium
Coloring Day #3 Supply & Demand 8GB Flashdrives
Sec. 3 The Role of Prices • What role do prices play in a free market system? • What advantages do prices offer? • What happens when prices are artificially set?
The Role of Prices in a Free Market In most cases, the price of anything is the result of the interaction between S and D: • Prices help move land, labor, and capital into the hands of producers, and finished goods into the hands of buyers. • Prices create an efficient way to allocate (“distribute”) resources for producers (recall the 3 basic q’s of econ?) • Create a language that both consumers and producers can use…let’s go a bit deeper on this point…
1. Prices work as an Incentive Prices communicate to both buyers and sellers whether goods or services are scarce or easily available. Prices can encourage or discourage production. 2. Signals Think of prices as a traffic light. A relatively high price is a green light telling producers to make more. A relatively low price is a red light telling producers to make less. 3. Flexibility In many markets, prices are much more flexible than production levels. They can be easily increased or decreased to solve problems of excess supply or excess demand. 4. Price System is "Free" Unlike central planning, a distribution system based on prices costs nothing to administer. Advantages of Prices Prices provide a language for buyers and sellers.
Price Ceilings • A price ceilingis a maximum price that can be legally charged for a good. • Example #1: rent control, a situation where a government sets a maximum amount that can be charged for rent in an area. • Example #2: During WWII, the U.S. Gov’t. froze wages AND prices to ensure war production was not interrupted In some cases the government steps in to control prices. These interventions appear as price ceilingsand price floors.
A price floor is a minimum price, set by the government, that must be paid for a good or service. One well-known price floor is the minimum wage, which sets a minimum price that an employer can pay a worker for an hour of labor. Price Floors
The Great Tortilla Crisis: • A sharp rise in the price of tortillas, a staple food of Mexico’s poor, which had gone from 25 cents a pound to between 35 and 45 cents a pound in just a few months in early 2007. Why were tortilla prices soaring? • It was a classic example of what happens to equilibrium prices when supply falls. Tortillas are made from corn; much of Mexico’s corn is imported from the United States, with the price of corn in both countries basically set in the U.S. corn market. And U.S. corn prices were rising rapidly thanks to surging demand in a new market: the market for ethanol.
Demand and Supply Shifts at Work in the Global Economy • A recent drought in Australia reduced the amount of grass on which Australian dairy cows could feed, thus limiting the amount of milk these cows produced for export. • At the same time, a new tax levied by the government of Argentina raised the price of the milk the country exported, thereby decreasing Argentine milk sales worldwide. • These two developments produced a supply shortage in the world market, which dairy farmers in Europe couldn’t fill because of strict production quotas set by the European Union.