Download
1 / 9
90 likes | 228 Views
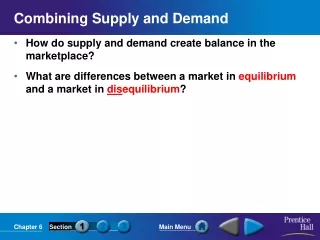
Combining Supply and Demand (Ch. 6-1). How do supply and demand create balance in the marketplace? What are differences between a market in equilibrium and a market in disequilibrium? What are the effects of price ceilings and price floors?.

E N D
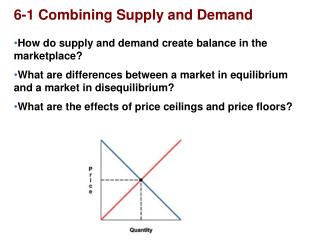
Combining Supply and Demand (Ch. 6-1) • How do supply and demand create balance in the marketplace? • What are differences between a market in equilibrium and a market in disequilibrium? • What are the effects of price ceilings and price floors?
The point at which quantity demanded and quantity supplied come together is known as equilibrium or Market Clearing Price. Finding Equilibrium Equilibrium Point Combined Supply and Demand Schedule $3.50 $3.00 $2.50 $2.00 $1.50 $1.00 $.50 Price of a slice of pizza Quantity demanded Quantity supplied Result $ .50 300 100 Shortage from excess demand Price per slice a Equilibrium Price $1.00 250 150 $1.50 200 200 Equilibrium Equilibrium Quantity $2.00 150 250 Supply Demand Surplus from excess supply $2.50 100 300 0 50 100 150 200 250 300 350 350 $3.00 50 Slices of pizza per day Balancing the Market
Excess Demand Excess demand occurs when quantity demanded is more than quantity supplied. Excess Supply Excess supply occurs when quantity supplied exceeds quantity demanded. Market Disequilibrium If the market price or quantity supplied is anywhere but at the equilibrium price, the market is in a state called disequilibrium. There are two causes for disequilibrium: Interactions between buyers and sellers will always push the market back towards equilibrium.
Price Ceilings In some cases the government steps in to control prices. These interventions appear as price ceilings and price floors. • A price ceiling is a maximum price that can be legally charged for a good. • An example of a price ceiling is rent control, a situation where a government sets a maximum amount that can be charged for rent in an area.
A price floor is a minimum price, set by the government, that must be paid for a good or service. One well-known price floor is the minimum wage, which sets a minimum price that an employer can pay a worker for an hour of labor. Price Floors
Changes in Market Equilibrium (Ch. 6-2) • How do shifts in supply affect market equilibrium? • How do shifts in demand affect market equilibrium? • How can we use supply and demand curves to analyze changes in market equilibrium?
Shifts in Supply • Understanding a Shift • Since markets tend toward equilibrium, a change in supply will set market forces in motion that lead the market to a new equilibrium price and quantity sold. • Excess Supply • A surplus is a situation in which quantity supplied is greater than quantity demanded. If a surplus occurs, producers reduce prices to sell their products. This creates a new market equilibrium. • A Fall in Supply • The exact opposite will occur when supply is decreased. As supply decreases, producers will raise prices and demand will decrease.
Shifts in Demand • Excess Demand • A shortage is a situation in which quantity demanded is greater than quantity supplied. • Search Costs • Search costs are the financial and opportunity costs consumers pay when searching for a good or service. • A Fall in Demand • When demand falls, suppliers respond by cutting prices, and a new market equilibrium is found.
Graph A shows how the market finds a new equilibrium when there is an increase in supply. Graph A: A Change in Supply Graph B: A Change in Demand $800 $600 $400 $200 0 $60 $50 $40 $30 $20 $10 Supply a b Original supply c c Price Price a b New demand New supply Demand Original demand 0 1 2 3 4 5 100 200 300 400 500 600 700 800 900 Output (in millions) Output (in thousands) Analyzing Shifts in Supply and Demand Graph B shows how the market finds a new equilibrium when there is an increase in demand.