Download
1 / 9
140 likes | 479 Views
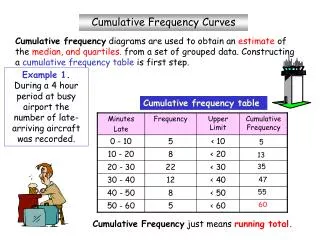
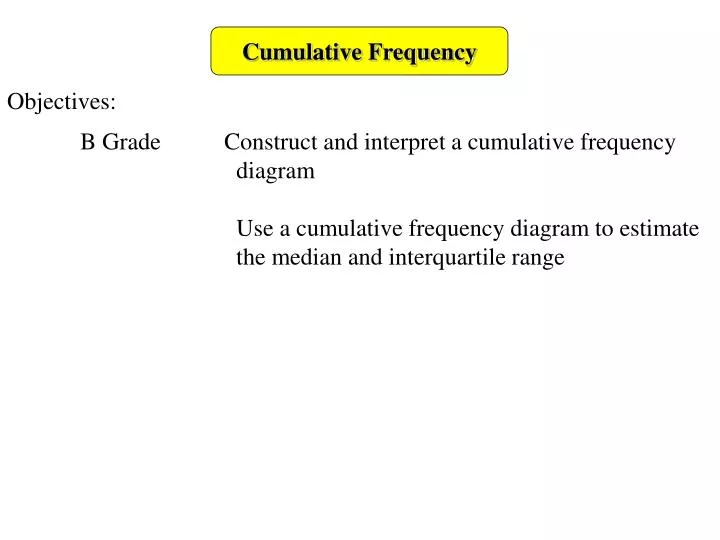
Cumulative Frequency. Objectives:. B Grade Construct and interpret a cumulative frequency diagram Use a cumulative frequency diagram to estimate the median and interquartile range. Cumulative Frequency.

E N D
Cumulative Frequency Objectives: B Grade Construct and interpret a cumulative frequency diagram Use a cumulative frequency diagram to estimate the median and interquartile range
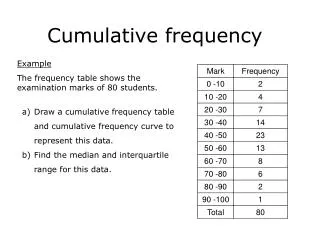
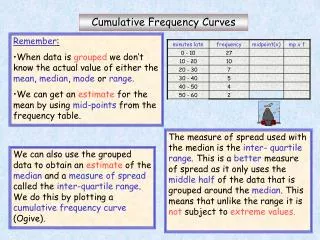
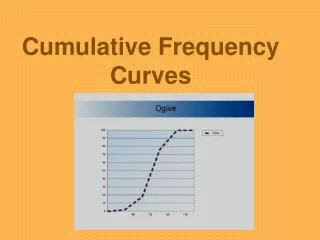
Cumulative Frequency A cumulative frequency diagram is a graph that can be used to find estimates of the median and upper and lower quartiles of grouped data. The median is the middle value when the data has been placed in order of size The lower quartile is the ‘median’ of the bottom half of the data set and represents the value ¼ of the way through the data. The upper quartile is the ‘median’ of the top half of the data set and represents the value ¾ of the way through the data.
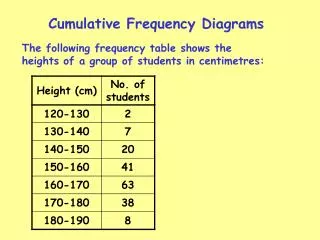
Cumulative Frequency A pet shop owner weighs his mice every week to check their health. The weights of the 80 mice are shown below: 3 8 13 22 33 48 62 70 76 80 Cumulative means adding up, so a cumulative frequency diagram requires a running total of the frequency.
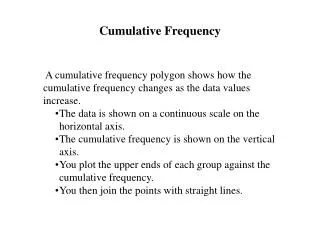
Cumulative Frequency x 80 70 60 50 40 30 20 10 0 x x x x Cumulative frequency 3 8 x 13 22 x 33 x 48 x 62 x 70 0 10 20 30 40 50 60 70 80 90 100 76 Weight (g) 80 The point are now joined with straight lines The cumulative frequency (c.f.) can now be plotted on a graph taking care to plot the c.f. at the end of each class interval. The line always starts at the bottom of the first class interval This is because we don’t know where in the class interval 0 < w ≤ 10, the values are, but we do know that by the end of the class interval there are 3 pieces of data The resulting graph should look like this and is sometimes called an ‘S’ curve.
Cumulative Frequency x 80 70 60 50 40 30 20 10 0 From this graph we can now find estimates of the median, and upper and lower quartiles x x Upper quartile x There are 80 pieces of data The lower quartile is the 20th piece of data ¼ of the total pieces of data The middle is the 40th x x The upper quartile is the 60th piece of data ¾ of the total pieces of data x Median position Cumulative frequency x Read across, then Down to find the median weight x x Lower quartile 0 10 20 30 40 50 60 70 80 90 100 Lower quartile is 38g Weight (g) Median weight is 54g Upper quartile is 68g
Cumulative Frequency The upper and lower quartiles can now be used to find what is called The interquartile range and is found by: Upper quartile – Lower quartile In this example: Upper quartile is 68g Lower quartile is 38g The interquartile range (IQR) = 68 – 38 = 30g Because this has been found by the top ¾ subtract the bottom ¼ ½ of the data (50%) is contained within these values So we can also say from this that half the mice weigh between 38g and 68g
Cumulative Frequency In an international competition 60 children from Britain and France Did the same Maths test. The results are in the table below: Using the same axes draw the cumulative frequency diagram for each country. Find the median mark and the upper and lower quartiles for both countries and the interquartile range. Make a short comment comparing the two countries
Cumulative Frequency Both have 60 pieces of data 2 1 Median position is 30 7 3 Lower quartile position is 15 18 7 34 15 Upper quartile position is 45 44 31 52 50 60 60 x Britain 60 50 40 30 20 10 0 France x x x France Britain x Cumulative frequency LQ = 13.5 LQ = 20 x Median = 19 Median = 25 x x UQ = 26 UQ = 29 x x x IQR = 12.5 IQR = 9 x x 0 5 10 15 20 25 30 35 Marks The scores in Britain are higher with less variation
Cumulative Frequency Summary B Grade Construct and interpret a cumulative frequency diagram Use a cumulative frequency diagram to estimate the median and interquartile range • Make a running total of the frequency • Put the end points not the class interval on the x axis • Plot the points at the end of the class interval • Join the points with straight lines – if it is not an ‘S’ curve • ****Check your graph**** • Find the median by drawing across from the middle of the • cumulative frequency axis • Find the LQ and UQ from ¼ and ¾ up the c.f. axis