Download
1 / 16
270 likes | 889 Views
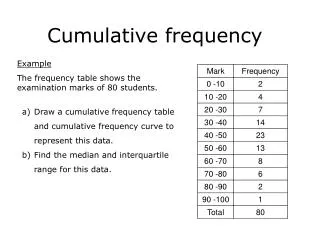
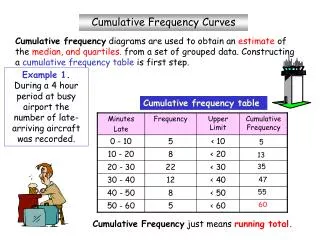
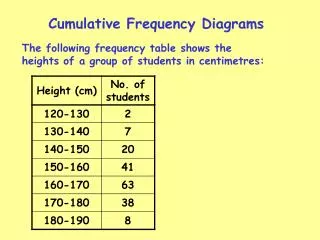
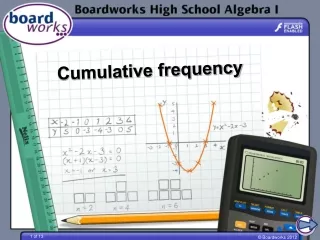
Cumulative Frequency Curves. Remember : When data is grouped we don’t know the actual value of either the mean , median , mode or range . We can get an estimate for the mean by using mid-points from the frequency table. minutes late. frequency. midpoint(x). mp x f. 0 - 10. 27.

E N D
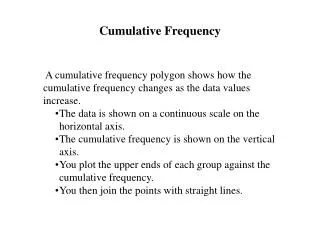
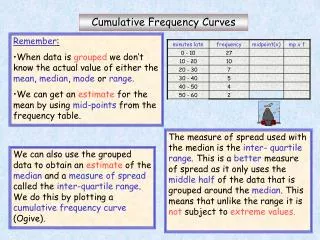
Cumulative Frequency Curves • Remember: • When data is grouped we don’t know the actual value of either the mean, median,mode or range. • We can get an estimate for the mean by using mid-points from the frequency table. minuteslate frequency midpoint(x) mp x f 0 - 10 27 10 - 20 10 20 - 30 7 30 - 40 5 40 - 50 4 50 - 60 2 The measure of spread used with the median is the inter- quartile range. This is a better measure of spread as it only uses the middle half of the data that is grouped around the median. This means that unlike the range it is not subject to extreme values. • Remember: • The measure of spread used with the mean is the range. • The range is not a good measure of spread as it is subject to extreme values. We can also use the grouped data to obtain an estimate of the median and a measure ofspread called the inter-quartilerange. We do this by plotting a cumulative frequencycurve (Ogive).
Cumulative Frequency Curves • Remember: • When data is grouped we don’t know the actual value of either the mean, median,mode or range. • We can get an estimate for the mean by using mid-points from the frequency table. minuteslate frequency midpoint(x) mp x f 0 - 10 27 Discuss the calculations below 10 - 20 10 Battery Life: The life of 12 batteries recorded in hours is: 2, 5, 6, 6, 7, 8, 8, 8, 9, 9, 10, 15 Mean = 93/12 = 7.75hours and the range = 15 – 2 = 13 hours. 20 - 30 7 30 - 40 5 40 - 50 4 2, 5, 6, 6, 7, 8, 8, 8, 9, 9, 10, 15 Median = 8hours and the inter-quartile range = 9 – 6 = 3 hours. 50 - 60 2
Cumulative Frequency Curves Cumulative frequency diagrams are used to obtain an estimate of the median, and quartiles. from a set of grouped data. Constructing a cumulative frequency table is first step. Example 1. During a 4 hour period at a busy airport the number of late-arriving aircraft was recorded. Cumulative frequency table Minutes Late Frequency Upper Limit Cumulative Frequency 0 - 10 5 < 10 10 - 20 8 < 20 20 - 30 22 < 30 30 - 40 12 < 40 40 - 50 8 < 50 50 - 60 5 < 60 5 13 35 47 55 60 Cumulative frequency just means running total.
Plotting the curve 70 Cumulative frequency table 60 Mins Late f Upper Limit CF 50 0 - 10 5 < 10 5 ¾ 10 - 20 8 < 20 13 40 20 - 30 22 < 30 35 Cumulative Frequency ½ 30 30 - 40 12 < 40 47 40 - 50 8 < 50 55 20 ¼ 50 - 60 5 < 60 60 Median = 27 10 UQ = 38 LQ = 21 0 40 50 20 30 60 70 10 Minutes Late IQR = 38 – 21 = 17 mins Plot the end point of each interval against cumulative frequency,then join the points to make the curve. Find the lower quartile. Get an estimate for the median. Find the Upper Quartile. Find the Inter Quartile Range.(IQR = UQ - LQ)
Cumulative Frequency Curves Cumulative frequency diagrams are used to obtain an estimate of the median and quartiles from a set of grouped data. Constructing a cumulative frequency table is first step. Cumulative frequency table Example 2.A P.E teacher records the distance jumped by each of 70 pupils. Distance (cm) No of pupils Upper Limit Cumulative Frequency 180 d 190 2 d 190 2 8 190 d 200 6 d 200 17 200 d 210 9 d 210 24 210 d 220 7 d 220 220 d 230 15 d 230 39 57 230 d 240 18 d 240 240 d 250 8 d 250 65 70 250 d 260 5 d 260 Cumulative frequency just means running total.
Plotting The Curve Cumulative Frequency Table ¾ 70 Distance jumped (cm) Number of pupils Cumulative Frequency 60 ½ 180 d 190 2 2 50 190 d 200 6 8 200 d 210 9 17 ¼ 40 Cumulative Frequency 210 d 220 7 24 Median = 227 30 220 d 230 15 39 UQ = 237 LQ= 212 230 d 240 18 57 20 240 d 250 8 65 250 d 260 5 70 10 0 180 190 200 210 220 230 240 250 260 Distance jumped (cm) IQR = 237 – 212 = 25 cm Plot the end point of each interval against cumulative frequency,then join the points to make the curve. Find the Lower Quartile. Get an estimate for the median. Find the Upper Quartile. Find the Inter Quartile Range.(IQR = UQ - LQ)
Interpreting Cumulative Frequency Curves 70 60 50 ¾ 40 Cumulative Frequency ½ 30 20 ¼ Median = 27 10 UQ =38 LQ = 21 0 40 50 20 30 60 70 10 Minutes Late The cumulative frequency curve gives information on aircraft arriving late at an airport. Use the curve to find estimates to (a) The median (b) The inter-quartile range (c) The number of aircraft arriving less than 45 minutes late. (d) The number of aircraft arriving more than 25 minutes late. IQR = 38 – 21 = 17 mins
Interpreting Cumulative Frequency Curves 70 The cumulative frequency curve gives information on aircraft arriving late at an airport. Use the curve to find estimates to: (a) The median (b) The inter-quartile range (c) The number of aircraft arriving less than 45 minutes late. (d) The number of aircraft arriving more than 25 minutes late. 60 50 40 Cumulative Frequency 30 20 10 0 40 50 20 30 60 70 10 Minutes Late 52 60 – 24 =36
70 60 50 40 Cumulative Frequency 30 20 Median = 27 10 0 40 50 20 30 60 10 Marks Interpreting Cumulative Frequency Curves The graph shows the cumulative frequency curve of the marks for students in an examination. Use the graph to find: (a) The median mark. (b) The number of students who got less than 55 marks. (c) The pass mark if ¾ of the students passed the test. 58 21 ¾ of the students passing the test implies that ¼ failed. (15 students)
140 120 100 80 Cumulative Frequency 60 40 20 0 400 600 500 100 200 300 Lifetime of bulbs in hours Interpreting Cumulative Frequency Curves The lifetime of 120 projector bulbs was measured in a laboratory. The graph shows the cumulative frequency curve for the results. Use the graph to find: (a) The median lifetime of a bulb. (b) The number of bulbs that had a lifetime of between 200 and 400 hours? (c) After how many hours were 80% of the bulbs dead?. (d) What was the shortest lifetime of a bulb? (d) 100 hours (b) 86 - 12 = 74 (c) 440 hours (a) 330 hours
70 60 50 ¾ 40 Cumulative Frequency ½ IQR = 38 – 21 = 17 mins 30 20 ¼ Median = 27 10 UQ = 38 LQ = 21 0 40 50 20 30 60 70 10 Minutes Late 20 0 10 30 40 50 60 Box Plot from Cumulative Frequency Curve
70 60 50 Mins Late f Upper Limit CF 40 0 - 10 5 < 10 Cumulative Frequency 10 - 20 8 < 20 30 20 - 30 22 < 30 20 30 - 40 12 < 40 40 - 50 8 < 50 10 50 - 60 5 < 60 0 40 50 20 30 60 70 10 Minutes Late Example 1
Example 2 70 60 50 Distance jumped (cm) Number of pupils Cumulative Frequency 40 Cumulative Frequency 180 d 190 2 30 190 d 200 6 200 d 210 9 20 210 d 220 7 220 d 230 15 10 230 d 240 18 240 d 250 8 0 180 190 200 210 220 230 240 250 260 250 d 260 5 Distance jumped (cm)
Interpreting Cumulative Frequency Curves 70 The cumulative frequency curve gives information on aircraft arriving late at an airport. Use the curve to find estimates to (a) The median (b) The inter-quartile range (c) The number of aircraft arriving less than 45 minutes late. (d) The number of aircraft arriving more than 25 minutes late. 60 50 40 Cumulative Frequency 30 20 10 0 40 50 20 30 60 70 10 Minutes Late
Interpreting Cumulative Frequency Curves 70 The graph shows the cumulative frequency curve of the marks for students in an examination. Use the graph to find: (a) The median mark. (b) The number of students who got less than 55 marks. (c) The pass mark if ¾ of the students passed the test. 60 50 40 Cumulative Frequency 30 20 10 0 40 50 20 30 60 10 Marks
Interpreting Cumulative Frequency Curves 140 The lifetime of 120 projector bulbs was measured in a laboratory. The graph shows the cumulative frequency curve for the results. Use the graph to find: (a) The median lifetime of a bulb. (b) The number of bulbs that had a lifetime of between 200 and 400 hours? (c) After how many hours were 80% of the bulbs dead?. (d) What was the shortest lifetime of a bulb? 120 100 80 Cumulative Frequency 60 40 20 0 400 600 500 100 200 300 Lifetime of bulbs in hours