Download
1 / 35
350 likes | 363 Views
This paper explores the integration of zero net energy (ZNE) goals with continual improvement strategies in ISO 50001 and Strategic Energy Management. It discusses the levels of zero energy ambition, the benefits of ZNE buildings, and the complexities of measuring ZNE. The paper also addresses questions on counting energy scope, emissions reduction, supply chain energy, transportation energy, and net production and consumption. It concludes with considerations for renewable energy boundaries and opportunities for consumer integration with the grid.

E N D
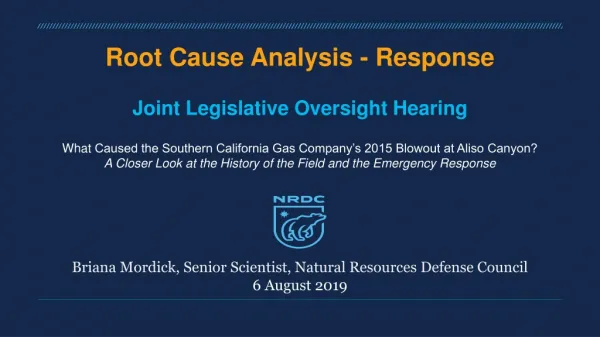
Something IS better than Zero: Integrating Continual Improvement and Zero Energy GoalsPresented At ACEEE Industrial Energy Efficiency Summer Study13 August 2019 David B. Goldstein, Ph.D. Natural Resources Defense Council dgoldstein@nrdc.org
Introduction to Zero Net Energy (ZNE) • Zero net energy goals are an important tool for meeting globally accepted climate goals (see next slide) • This paper describes 4 levels of “zero” with increasing levels of ambition • These levels can be integrated with the continual improvement goals in ISO 50001 and “Strategic Energy Management”
“Nothing is better than zero” Zero Net Energy has attracted rapidly growing interest around the world Growth rates of projected and verified Zero Energy buildings are continuing to be high Some industrial facilities claim Zero Energy performance Zero Energy is an easily understood concept that helps make efficiency visible Zero Energy buildingsmay not cost more to build than conventional practice, but they provide non-energy benefits such as comfort, health, etc. Zero Energy industrial plants may also provide improved profitability and quality
But… • What do we mean by zero? • Zero Net Energy does not mean zero energy bills • After Zero Net Energy facilities--or even stand-alone solar and wind energy--become common, Zero Net Energy does not mean zero emissions from the grid • Key questions this talk will address: • What is the scope of a Zero Energy facility: how do you count energy? • How can you zero out emissions? • What if you count supply chain energy of construction of the facility? • What if you count transportation energy to service it? • How does a Zero Energy goal fit into an Energy Management System that is built around continual improvement?
How do we net out production and consumption? • Current definitions globally look at accumulated annual energy consumption and accumulated on-site renewable energy production • When production equals consumption this is called Zero Net Energy • But this metric has complexities that will be discussed next
Zero Net Energy is the same thing as 100% renewable energy, right? • Not exactly: • 100% renewables can be achieved by just spending money, while ZNE requires thought and action within the facility • 100% renewables might include renewable energy far removed from the plant site (such as solar in Sri Lanka for a plant in Alabama) • Are the offsite renewables additional? How do we know? • ZNE buildings almost always are extremely efficient: efficiency comes first and renewables second
Renewable Energy Production: where do we draw the boundaries? Geographically: Temporally: By the year for the first year? Continually by the year for N years into the future? Measured by annual average or on an hourly or 15-minute basis? • At the unit? • At the property? • At the subdivision? • At some specified distance? • What about RECs?
How do existing ZNE Standards draw these geographic boundaries? • Offsite renewables are generally discouraged if not outright disallowed • The use of Renewable Energy Credits (RECs) is usually prohibited or deeply discounted; and • RECs from onsite renewables must be retired, not sold • The issue is complex: questions include ownership of the renewables, treatment of RECs, connection of the renewables to the facility, control over the renewables, distance from the site… • Consistent standards would be helpful
How do existing ZNE Standards draw these temporal boundaries? • Current standards look at annual averages and consider only one year, or look at achievement of ZNE one year at a time • This paper looks at long-term plans over ten years or longer • It also recommends consideration of short-term (hourly or shorter) energy balance
This is the duck: (net electricity loads in California vs. time of day)
California GHG Emissions Factors 2018 * CPUC Avoided Cost Model 2018: http://www.cpuc.ca.gov/General.aspx?id=5267
Energy efficiency remains essential to address annual variation Potential Shift to Winter Peak Under High Electrification Scenario NEEP: Northeastern Regional Assessment of Strategic Electrification, July 2017 https://neep.org/strategic-electrification-regional-assessment
Opportunities for Consumer Integration with Grid • Permanent Efficiency • Reduce energy loads… • Peak Shifting • Design to modify time of peak energy use to adapt to grid… • Dynamic Response • Actively reduce energy use in response to short-term grid constraints… • Dispatchable Energy Storage • Actively manage energy use patterns based on grid signals…
Facility Load Curve Peak Shift ADR Storage Base Load Load Factor Energy Efficiency
Process design evaluation should include load shape predictions so that fixed and adjustable building features can be incorporated to manage load shape. EnergyModeling 3D Electric Profile, Full Year
Integrating ZNE and SEM • This paper defines four levels of ZNE and suggests continual improvement from the lowest level to higher levels: • ZNE as annual average • ZNE considering the energy inputs to the grid and a time of use basis • ZNE considering in addition the energy required to construct the facility • ZNE considering in addition transportation energy of supplies and people to the site
Zero Energy and Continual Improvement • Definitions of zero energy often focus on metered energy use • If energy performance (which doesn’t count renewables) is continually improving, net zero in year N means net consumption in years N-1, N-2…etc. • And it also implies net positive contribution to the grid in years N+1, N+2… • Designers can specify an energy policy for continual improvement that brings the facility to Zero Net in a planned year • Outcomes are projected using a very simplified model (see Annex 1)
Transportation may not change crossover much (with lots of solar generation)
Conclusions • The Zero Net Energy concept is proving an attractive way of making efficiency visible and encouraging renewable energy use • Zero Net Energy will not result in zero utility bills nor in zero carbon emissions, but • Continual improvement can allow zero emissions at a projected year in the foreseeable future • Zeroing out construction energy and transportation makes the goal much more difficult and requires much greater use of renewables
Thank you Please contact me at DGoldstein@NRDC.org for questions or comments
[Assumptions for model] • Zero energy building uses 40% of the energy of a conventional building • The conventional building creates about as much emissions to construct as it does to operate over 50 years • The carbon intensity of emissions avoided by solar on-site is 60% of the grid average • Energy consumption before counting solar declines at 3% (alternately 5%) annually • Transportation emissions are about half the operational emissions of the conventional building • Grid emissions intensity stays constant in the model, but energy performance improvements may include Demand Response