Download
1 / 1
10 likes | 74 Views
1,2 Melissa Gilbert , 1,2 Needoba, J., 3 Koch, C., 3 Barnard, A., 2 Baptista, A. 1 Oregon Health and Science University 2 The Center for Coastal Margin Observation and Prediction 3 WET Labs. Results:. Research Question

E N D
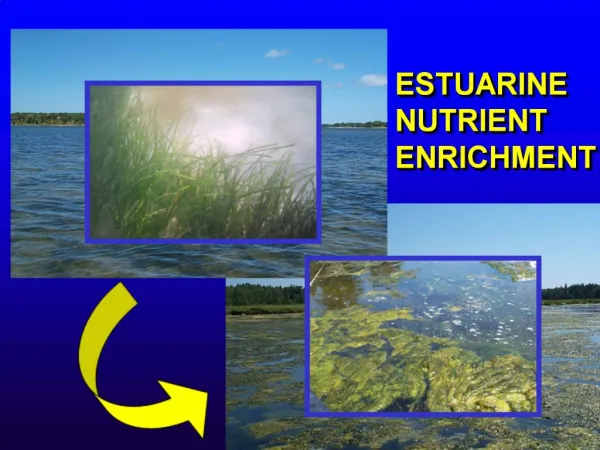
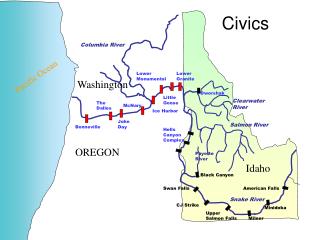
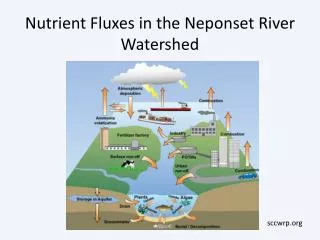
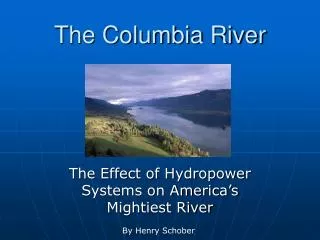
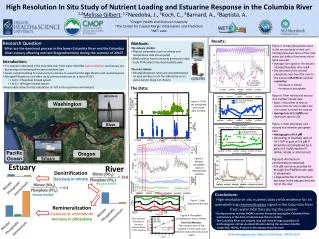
1,2Melissa Gilbert, 1,2Needoba, J., 3Koch, C., 3Barnard, A., 2Baptista, A. 1Oregon Health and Science University 2The Center for Coastal Margin Observation and Prediction 3WET Labs Results: Research Question What are the dominant process in the lower Columbia River and the Columbia River estuary affecting nutrient biogeochemistry during the summer of 2010? • Methods: • The estuary station: • Physical parameters such as salinity and • temperature data are acquired • APNA collects hourly nitrate & ammonium data • Cycle-PO4 collects hourly phosphate data • The river station: • Nitrate/phosphate ratios are calculated based • on grab samples run in the laboratory on an • auto analyzer (data not shown) • Figure 5. Nitrate/phosphate ratios in the estuary (gray circles) and nitrate/phosphate ratios of the river water just before it becomes saline (pink squares) • Average river signal in the estuary • nitrate/phosphate ratio is 6.4 • The decrease in the nitrate/ • phosphate ratio from the river to • the estuary (24.8→6.4) could be • caused by: • Decrease in nitrate • Increase in phosphate • Figure 6. River nitrate and estuary end member nitrate data • Note: 1 day offset of data to • account the for time it takes the • river water to reach the estuary • Average loss of 1.3 μM(only • decreases ratio to 20) • Figure 7. River phosphate and estuary end member phosphate data • Average gain of 0.4 μM • According to Redfield ratio of • 16/1 N/P a gain of 0.4μM P • should be accompanied by a • gain of 6.4 μM reactive N • (either nitrate or ammonium) • Figure 8. Ammonium concentrations observed • 6.4 μM can be accounted for • through the Redfield ratio gain • in phosphate • Large amounts of ammonium • are seen in the estuary that are • not in the river APNA • Introduction: • It is vital we understand if the Columbia river fresh water tidal flats (red oval below) and estuary are • decreasing or increasing the coastal nutrient load • Excess nutrient loading to coastal zones is known to cause harmful algal blooms and coastal hypoxia • Nitrogen/Phosphorus are taken up by primary producers at a ratio of 16/1 • > 16/1 = Phosphate limited system • < 16/1 = Nitrogen limited system • Hourly data allows for the calculation of N/P in the estuarine environment High Resolution In Situ Study of Nutrient Loading and Estuarine Response in the Columbia River Cycle-PO4 The Data: SATURN-05 Figure 1. All of the phosphate and nitrate data for 2010 Washington Small Loss in Nitrate River SATURN-03 Large Gain in Phosphate Pacific Ocean Oregon Estuary Figure 2. Nitrate/ phosphate ratios of intermediate salinities Large Gain in Ammonium Estuary River Denitrification Decrease in nitrate 6.4- Remineralization Phosphate Limited • Conclusions: • High resolution in situ nutrient data yields evidence for an overwhelming remineralization signal in the Columbia River fresh water tidal flats during the summer • During summer months MORE reactive N may be leaving the Columbia River • and estuary in the form of ammonium than in nitrate • The Columbia River and estuary may not remove large quantities of • anthropogenic nitrate via denitrification during the summer months • Lower NO3-N/PO4-P ratios in the estuary than the river Nitrate Limited Figure 3. High frequency tidal data Remineralization Increase in ammonium Increase in phosphate Figure 4. Phosphate concentration versus salinity Zero salinity/ intercept is the river concentration in the estuary River End Member: The concentration of the nutrient in fresh water just before it mixes with salty ocean water Acknowledgements: Astoria Field Team, CMOP Staff