Motion Graphs Part Two
This review covers essential concepts related to motion graphs, including the line of best fit, slope interpretation, and the calculations of velocity and acceleration. It explains how to determine instantaneous velocity using tangent lines and find acceleration values from various types of graphs. Different acceleration scenarios (positive, negative, and zero) are discussed, accompanied by practical examples and calculations. Understanding these principles is crucial for analyzing motion and forces in physics.


Motion Graphs Part Two
E N D
Presentation Transcript
Review: Line of Best Fit Line of best fit - A line on a graph drawn so that there are the same number of data points above as below the line.
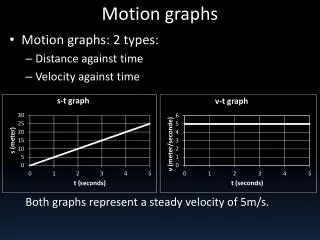
What does the slope or rate of change mean in this graph? SPEED
What does the slope or rate of change mean in this graph? VELOCITY
Acceleration: a = ΔvΔt Acceleration is rate at which an object changes its velocity. It is a vector quantity A person can be moving very fast, and still not be accelerating. Anytime an object's velocity is changing, that object is said to be accelerating.
Acceleration on position-time graphs On a position-time graph, or distance-time graph, a curved line represents a change in velocity.
Find Instantaneous Velocity 1. Draw a tangent line to the slope 2. Pick two points (3, 2) & (0.5, 11) 3. Calculate the slope A = ∆v / ∆t A = (2 – 11) / (3 – 0.5) A = -3.6 m/s2
Graphing Acceleration - A car that moves at a uniform (constant) velocity to the right at + 10 m/s - A car with a constant velocity has an acceleration of ZERO (no change in the velocity). NOTE: Y-axis is VELOCITY and Not distance - The slope of a horizontal line on a graph = 0
- A car moves to the right and its velocity is increasing at a steady rate. This means that it has a positive acceleration. - The graph would look like: - Note that the slope is positive.
We can have 3 graph shapes for Velocity vs. Time. 2. Positive acceleration (speeding up) 1. No acceleration v v t t 3. Negative acceleration (slowing down, decelerating) v t
Finding Acceleration on a Velocity Time Graph Acceleration = ∆v ∆t A = (vfinal – vinitial) (tfinal – tinitial) A = (8m/s – 0m/s) (4s – 0s) A = 8m/s 4s A = 2m/s2
Graphing Instantaneous Acceleration What is the instantaneous acceleration at 3.5 s? Draw tangent Pick two points on line (1.5, 8) & (4.5, 10) Calculate the slope (10 – 2) / (4.5 – 1.5) 2.67 m/s2
Completing Tables ∆t = tf – ti ∆t = 55s – 5s = 50s ∆v = vf – vi ∆v = -15m/s - +10m/s = -25 m/s Aav = ∆v ÷ ∆t Aav = -25m/s / 50s = -0.5 m/s2 Tf = 25s ∆v = +65m/s a = +2.6m/s2