Analyzing Two Populations: Comparing Graphical Data Representations
This guide explores the comparison of two populations through various graphical representations, including double line plots, back-to-back stem-and-leaf plots, double bar graphs/histograms, and double box plots. Real-life examples illustrate how to analyze training times, building heights, and sports team performance. We will derive insights into consistency, averages, and interquartile ranges while practicing key analytical skills. This resource is designed to enhance understanding of comparative data analysis.

Analyzing Two Populations: Comparing Graphical Data Representations
E N D
Presentation Transcript
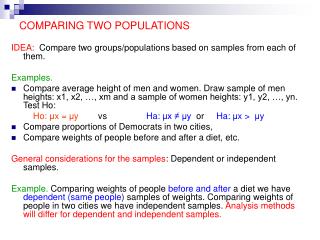
So far, we have looked at single graphs and made inferences about one population. Now we are going to compare two graphs and make inferences about two populations. We will see examples of a: • Double Line Plot • Back-to-back Stem and Leaf Plot • Double Bar Graph/Histogram • Double Box Plot
The double line plot shows the number of minutes Katie and Danielle trained for a cross-country run. Which statement is true? Danielle’s times are more spread out. Katie’s times are more spread out.
Which statement is true? Danielle’s times are more consistent. Katie’s times are more consistent.
Find the mean of each line plot. Who has higher average training time? Katie’s Average Time: 64.9 min Danielle’s Average Time: 70.8 min Danielle has the higher average training time.
The double histogram shows the heights of the tallest buildings in Atlanta and Charlotte. Which statement is true? Atlanta has the tallest building. Charlotte has the tallest building.
Which statement is true? Atlanta has more buildings that are 800-899 ft tall. Charlotte has more buildings that are 800-899 ft tall.
The back-to-back stem and leaf plot shows the number of wins of two middle school baseball teams for the past ten years. Which statement is true? Westland MS has a more consistent number of wins. EastfieldMS has a more consistent number of wins.
Find the median number of wins for each team. Westland: 24 games Eastfield: 26 games
The double box plot shows the height (in inches) of the boys and girls in Ms. Castle’s class. Which statement is true? The boys are generally taller. The girls are generally taller.
The double box plot shows the height (in inches) of the boys and girls in Ms. Castle’s class. Which statement is true? 75% of boysare 67 inches or shorter. 75% of girlsare 67 inches or shorter.
Find the Inter-quartile Range for girls and boys. What do you notice? What does this mean? Girls IQR: 67-64 = 3 Boys IQR: 69-66 = 3 They are the same. This means 50% of the heights are equally spread out around the medians.