Download
1 / 16
160 likes | 176 Views
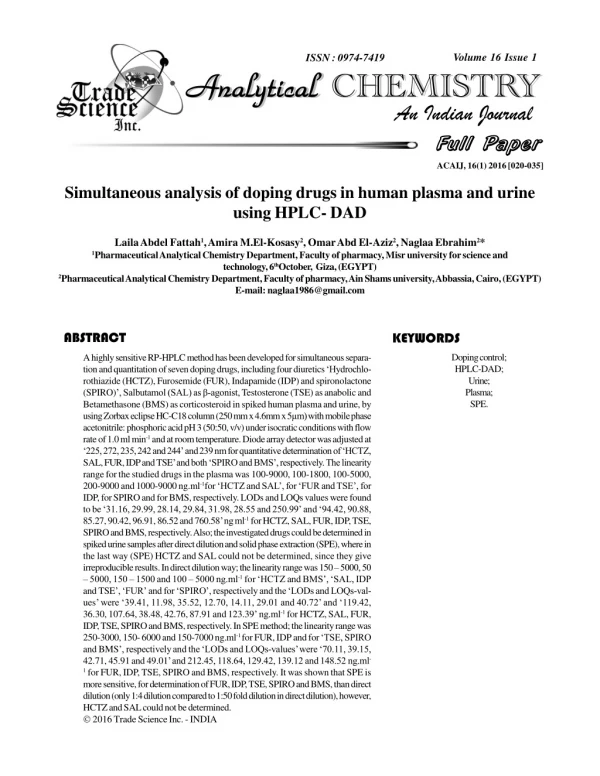
AhighlysensitiveRP-HPLCmethod has been developedforsimultaneousseparation and quantitation ofseven doping drugs, includingfour diureticsu00ebHydrochlorothiazide (HCTZ), Furosemide (FUR), Indapamide (IDP) and spironolactone (SPIRO)u00ed, Salbutamol (SAL) as u201a-agonist, Testosterone (TSE) as anabolic and Betamethasone (BMS) as corticosteroid in spiked human plasma and urine, by usingZorbaxeclipseHC-C18column(250mmx4.6mmx5u00b5m)withmobilephase acetonitrile: phosphoric acid pH3 (50:50, v/v)underisocratic conditionswith flow rate of 1.0mlmin -1 and atroomtemperature.Diode array detectorwas adjusted at u00eb225, 272, 235,242 and 244u00ed and239nmforquantitativedetermination ofu00ebHCTZ, SAL, FUR,IDPandTSEu00edand both u00ebSPIROandBMSu00ed,respectively.The linearity range for the studied drugsin the plasma was 100-9000, 100-1800, 100-5000, 200-9000 and 1000-9000 ng.ml -1for u00ebHCTZ and SALu00ed,for u00ebFUR andTSEu00ed, for IDP,for SPIRO and forBMS,respectively. LODs and LOQs values were found to be u00eb31.16, 29.99, 28.14, 29.84, 31.98, 28.55 and 250.99u00ed and u00eb94.42, 90.88, 85.27, 90.42, 96.91, 86.52 and 760.58u00edngml -1 forHCTZ, SAL, FUR,IDP,TSE, SPIROandBMS,respectively.Also;theinvestigated drugs could bedetermined in spiked urinesamples after directdilutionandsolidphase extraction(SPE),where in the last way (SPE) HCTZ and SAL could not be determined, since they give irreproducible results.Indirectdilutionway;the linearityrangewas 150u00f1 5000, 50 u00f1 5000, 150 u00f1 1500 and 100 u00f1 5000 ng.ml -1 for u00ebHCTZ and BMSu00ed, u00ebSAL, IDP and TSEu00ed,u00ebFURu00ed and for u00ebSPIROu00ed,respectively and the u00ebLODs and LOQs-val- uesu00ed were u00eb39.41, 11.98, 35.52, 12.70, 14.11, 29.01 and 40.72u00ed and u00eb119.42, 36.30, 107.64, 38.48, 42.76, 87.91 and 123.39u00ed ng.ml -1 for HCTZ, SAL, FUR, IDP,TSE, SPIROandBMS,respectively.In SPEmethod;the linearity rangewas 250-3000, 150- 6000 and 150-7000 ng.ml -1 for FUR,IDP and foru00ebTSE, SPIRO and BMSu00ed, respectively and the u00ebLODs and LOQs-valuesu00edwere u00eb70.11, 39.15, 42.71, 45.91 and 49.01u00edand 212.45, 118.64, 129.42, 139.12 and 148.52 ng.ml - 1 for FUR, IDP, TSE, SPIRO and BMS, respectively. It wasshown that SPE is more sensitive,for determination ofFUR,IDP,TSE, SPIROandBMS, than direct dilution(only1:4dilutioncomparedto1:50folddilutionindirectdilution),however, HCTZandSALcould not be determined.

E N D
id1949343 pdfMachine by Broadgun Software - a great PDF writer! - a great PDF creator! - http://www.pdfmachine.com http://www.broadgun.com Volume 16 Issue 1 ISSN : 0974-7419 Analytical Analytical CHEMISTRY Analytical Analytical CHEMISTRY An Indian Journal Full Paper Full Paper ACAIJ, 16(1) 2016 [020-035] Simultaneous analysis of doping drugs in human plasma and urine using HPLC- DAD Laila Abdel Fattah1, Amira M.El-Kosasy2, Omar Abd El-Aziz2, Naglaa Ebrahim2* 1Pharmaceutical Analytical Chemistry Department, Faculty of pharmacy, Misr university for science and technology, 6thOctober, Giza, (EGYPT) 2Pharmaceutical Analytical Chemistry Department, Faculty of pharmacy, Ain Shams university, Abbassia, Cairo, (EGYPT) E-mail: naglaa1986@gmail.com ABSTRACT KEYWORDS Doping control; HPLC-DAD; Urine; Plasma; SPE. A highly sensitive RP-HPLC method has been developed for simultaneous separa- tion and quantitation of seven doping drugs, including four diuretics ‘Hydrochlo- rothiazide (HCTZ), Furosemide (FUR), Indapamide (IDP) and spironolactone (SPIRO)’, Salbutamol (SAL) as â-agonist, Testosterone (TSE) as anabolic and Betamethasone (BMS) as corticosteroid in spiked human plasma and urine, by using Zorbax eclipse HC-C18 column (250 mm x 4.6mm x 5µm) with mobile phase acetonitrile: phosphoric acid pH 3 (50:50, v/v) under isocratic conditions with flow rate of 1.0 ml min-1 and at room temperature. Diode array detector was adjusted at ‘225, 272, 235, 242 and 244’ and 239 nm for quantitative determination of ‘HCTZ, SAL, FUR, IDP and TSE’ and both ‘SPIRO and BMS’, respectively. The linearity range for the studied drugs in the plasma was 100-9000, 100-1800, 100-5000, 200-9000 and 1000-9000 ng.ml-1for ‘HCTZ and SAL’, for ‘FUR and TSE’, for IDP, for SPIRO and for BMS, respectively. LODs and LOQs values were found to be ‘31.16, 29.99, 28.14, 29.84, 31.98, 28.55 and 250.99’ and ‘94.42, 90.88, 85.27, 90.42, 96.91, 86.52 and 760.58’ ng ml-1 for HCTZ, SAL, FUR, IDP, TSE, SPIRO and BMS, respectively. Also; the investigated drugs could be determined in spiked urine samples after direct dilution and solid phase extraction (SPE), where in the last way (SPE) HCTZ and SAL could not be determined, since they give irreproducible results. In direct dilution way; the linearity range was 150 – 5000, 50 – 5000, 150 – 1500 and 100 – 5000 ng.ml-1 for ‘HCTZ and BMS’, ‘SAL, IDP and TSE’, ‘FUR’ and for ‘SPIRO’, respectively and the ‘LODs and LOQs-val- ues’ were ‘39.41, 11.98, 35.52, 12.70, 14.11, 29.01 and 40.72’ and ‘119.42, 36.30, 107.64, 38.48, 42.76, 87.91 and 123.39’ ng.ml-1 for HCTZ, SAL, FUR, IDP, TSE, SPIRO and BMS, respectively. In SPE method; the linearity range was 250-3000, 150- 6000 and 150-7000 ng.ml-1 for FUR, IDP and for ‘TSE, SPIRO and BMS’, respectively and the ‘LODs and LOQs-values’ were ‘70.11, 39.15, 42.71, 45.91 and 49.01’ and 212.45, 118.64, 129.42, 139.12 and 148.52 ng.ml- 1 for FUR, IDP, TSE, SPIRO and BMS, respectively. It was shown that SPE is more sensitive, for determination of FUR, IDP, TSE, SPIRO and BMS, than direct dilution (only 1:4 dilution compared to 1:50 fold dilution in direct dilution), however, HCTZ and SAL could not be determined. 2016 Trade Science Inc. - INDIA
ACAIJ, 16(1) 2016 Naglaa Ebrahim et al. 21 Full Paper Full Paper INTRODUCTION ment of bronchial asthma, however, athletes must obtain a therapeutic use exemption (TUE) document- ing their compromised lung function. Because of SAL’s potential anabolic effects when taken orally, it is only permitted after inhaled administration, and it is carefully monitored by WADA through urine analysis, both in and out of competition. Currently, urine concentrations greater than 1000 ng.mL-1 are considered adverse findings and are indicative of oral administration, regardless of whether the ath- lete has a TUE[8]. In addition to its antiasthmatic effects, â2-ago- nists have been pharmacologically proven to be able to improve nitrogen retention, reduce body fat and promote muscle growth. As a result; there is much interest in the determination of these substances in body fluids. However, the hydrophilicity of the â2- agonists coupled with the low concentrations found in urine and plasma makes the analysis relatively difficult[9]. SAL is a prohibited substance with two thresh- old values. Urine concentrations over 100 and be- low 1000 ngmL-1 are considered to imply stimulant dosage while over 1000 ngmL-1, salbutamol is re- garded as anabolic agent[10, 11]. Anabolic steroids are chemical, synthetic deriva- tives of TSE modified to enhance the anabolic rather than the androgenic actions of the hormone[12]. TSE is a steroid hormone, synthesized in the human body from cholesterol. It serves distinct functions at dif- ferent stages of life. During embryonic life, andro- gen action is central to the development of the male phenotype. At puberty, the hormone is responsible for the secondary sexual characteristics; that trans- form boys into men. TSE regulates many physiologi- cal processes in the adult male including muscle pro- tein metabolism, sexual and cognitive functions, erythropoiesis, plasma lipid levels, and bone me- tabolism[13]. Anabolic steroids are used in the treatment of osteoporosis and the anemia associated with chronic renal failure. It increases hemoglobin and the mass of red blood cells. They are used as a doping agent to build muscle mass, increase bone density and stimulate appetite. Furthermore, it might also enhance erythropoietic-stimulating factor to increase the A great number of drugs with minimum required performance limits (MRPL) are currently included in the list of prohibited substances, as shown in Er- ror! Reference source not found.), published by World Anti-Doping Agency (WADA)[1,2]. Numerous technical approaches are needed to analyze the great diversity of doping agents and confirm the findings. Doping analysis has to conform to the requirements of International Standards for Laboratories estab- lished by WADA including e.g. chain of custody, validation of screening and confirmation methods and criteria for identification[3,4]. The progressive appearance of new abused drugs challenges the dop- ing laboratories to update their detection methods. Today, doping analysis requires the use of several different chromatographic, mass spectrometric and immunological methods. Consequently, using a large number of separate analytical procedures results in a more complex, time-consuming and laborious screening procedure. Diuretics are pharmaceutical drugs which are used to increase urine flow by promoting the excre- tion of water by the kidneys. They are used often for the treatment of heart conditions, liver, kidney or lung disease to alleviate salt or water retention. Their potent ability to excrete water has caused diuretics to be misused in sport; where rapid weight loss is required to meet a weight category. It has also been used to ensure the urine is diluted; so that, the detec- tion of other banned substances is made more diffi- cult. Thus the use of diuretics in sport is banned at competition. The urine dilution effect of diuretics also allows them to be classified as masking agents and precludes their use both in and out of competi- tion[5]. There are several classes of diuretic drugs— Thiazides (e.g., HCTZ), loop diuretics (e.g., FUR), potassium sparing diuretics (e.g., AMI), carbonic anhydrase inhibitors (e.g., acetazolamide), osmotic diuretics (e.g., mannitol) and mercurial diuretics (e.g., mersalyl). The drugs are all relatively polar and hence are amenable to analysis by HPLC using C18 type phases with diode array (DAD) or fluo- rescence detection[6,7]. â2-adrenoceptor agonists (SAL) used in the treat- Analytical Analytical CHEMISTRY Analytical Analytical CHEMISTRY An Indian Journal
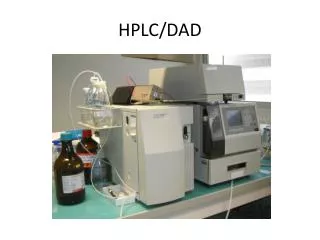
Simultaneous analysis of doping drugs in human plasma and urine using HPLC- DAD . 22 ACAIJ, 16(1) 2016 Full Paper Full Paper erythrocyte production. Other effects include in- creased levels of low-density lipoproteins and de- creased levels of high-density lipoproteins[14]. Corticosteroids are very potent anti-inflamma- tory products used in the treatment of chronic asth- matic symptoms. However, they have severe poten- tial side effects when used without medical control, such as permanent skin atrophy and pustule psoria- sis. Moreover, some systematic side effects are hy- pertension, diabetes mellitus, osteoporosis, allergic contact dermatitis, Cushing’s syndrome … etc. They have an effect on the nervous system, and can cause euphoria and improve an athlete’s ability to concen- trate in performance of endurance events and power events. Corticosteroids can alleviate pain in gen- eral. Due to the higher physical exertion, pain and injuries are often consequences of sports, and hence corticosteroids are widely used as pain and inflam- matory relieving agents. They are now on the list of substances banned by the International Olympic Com- mittee (IOC)[15]. Systemic use of corticosteroids is forbidden in all circumstances but, when medically necessary, local and intra-articular injections are allowed under medical supervision[16]. WADA MRPL for the accredited laboratories[17] is indeed not a threshold value, nor is it a limit of detection (LOD) or a limit of quantification (LOQ), but rather a parameter to assess laboratory perfor- mance, this meaning that; adverse analytical find- ings may result from concentrations below the MRPL, provided the identification criteria[18] are satisfied. This means that; since a urinary threshold value is presently set up only for a few compounds (e.g. ephedrines, SAL), the analysis of urine samples may not allow to discriminate between remote rec- reational/therapeutic use of stimulants and a real doping offence. The aim of this work is to develop analytical separation technique to screen seven prohibited drugs of different pharmacological classes and determine them at very low limits in spiked urine and plasma. including ‘Acetonitrile, Methanol and water’ (Sigma Gmbh, Germany) Phosphoric acid (Reidel-deHaën, Germany). Frozen human plasma batch No. 071937 was obtained from VACCERA, Giza, Egypt. Human urine samples were obtained from healthy volun- teers after getting their informed consent. All samples were stocked in plastic tight closed tubes at - 20°C prior to analysis (1 week maximum storage time). Reference samples ‘HCTZ and SPIRO’, ‘FUR, SAL, BMS and IDP’ and TSE were kindly provided by Kahira Pharma- ceutical Co., Arab Drug Company (ADCO) and CID pharmaceutical Co., (Cairo, Egypt). The purities were certified to be 99.66%, 99.67%, 99.55%, 99.63%, 99.59, 99.55% and 99.65%, respectively. Instrumentation Waters Alliance e2695 HPLC binary pump (WatersTechnology, Milford, MA) equipped with an in-line vacuum degassing auto-sampler with capac- ity for 120 vials with programmable temperature control, heated column compartment and photodiode array detector (model 2998). All components of the HPLC system were controllable through the Em- power 3 chromatography data software. Zorbax eclipse HC-C18 column (250 mm x 4.6mm x 5µm). 0.2 µm disposable membrane filters (Millipore corp., Milford, MA, USA). Jenway pH meter 3310 pH /mV/°C. Table- top Centrifuge PLC-05, Germany Industrial Corp., associated with Cannic, USA. Soni- cator (Crest ultrasonics, scotch road. Mercer, coun- try airport, Trenton, NJ 08628). Micropipette. Solid Phase Extraction: 12 Port Vacuum Extraction Mani- fold Assy (Phenomenex) with Vacuum Pump, Beco,Germany. SPE C18 cartridges.balance. vor- tex LC parameters At room temperature, under isocratic condition acetonitrile: phosphoric acid pH 3 (50:50, v/v) used mobile phase with a flow rate of 1.0 ml min-1. Im- mediately before use; all solvents were filtered through 0.2 µm membrane filter and degassed in an ultrasonic bath. Zorbax eclipse HC-C18 column (250 mm x 4.6mm x 5µm) was equilibrated with mobile EXPERIMENTAL Chemicals and reagents All reagents and solvents were of HPLC grade, Analytical Analytical CHEMISTRY Analytical Analytical CHEMISTRY An Indian Journal
ACAIJ, 16(1) 2016 Naglaa Ebrahim et al. 23 Full Paper Full Paper phase. Sample solutions, after pretreatment and prior to injection, were filtered through 0.2 µm syringe filter. DAD was adjusted at 225, 272, 235, 242, 244 nm for quantitative determination of HCTZ, SAL, FUR, IDP and TSE, respectively and at 239 nm for both SPIRO and BMS. Preparation of standard solutions Stock standard solutions (1mg.ml-1): HCTZ, SAL, FUR, IDP, TEST, SPIRO and BMS stock so- lutions were prepared by transferring 100 mg of each separately into 100-ml volumetric flask and com- pleted to mark with acetonitrile. Working standard solutions:(Solution A) (100 µg.ml-1) Standard working mixture solution A was pre- pared by transferring 10 ml of each of their corre- sponding previously prepared stock standard solu- tions into 100-ml volumetric flask and completed to mark with the mobile phase. (Solution B) (10 µg.ml-1) Standard working mixture solution B was pre- pared by transferring 10 ml of their previously pre- pared working standard solutions (A) into 100-ml volumetric flask and completed to mark with the mobile phase. The studied drugs were chosen according to the list of banned substances in the Olympic Movement Anti-doping Code and needed to be detected em- phatically in routine analysis. Sample preparation For plasma Accurately measured volumes (20 - 100 µl) of solution B and (10-200 µl) of solution A were trans- ferred, separately, into 20 ml stoppered shaking tubes and the volume was completed to 2-mls with plasma. 4-mls acetonitrile were added to each tube, then the mixtures were vortexed for 2 minutes and centri- fuged for 20 minutes at 4500 rpm. 2 mls taken from the upper layer in each tube, were transferred to a beaker, left to evaporate till dryness at room tem- perature and reconstituted in 2-mls of the mobile phase. The reconstituted solutions, having concen- trations in a range of (100 - 10000 ng.ml-1) for the drug mixture were then filtered through 0.2 µm millipore syringe filters. For urine For direct dilution, urine was spiked with (10- 100 ìl) of solution B and (12-100 ìl) of solution A and diluted (1:50) with water to prepare spiked urine samples (2 mls) of concentrations (50-5000 ng.ml- 1), then filtered through 0.2 µm millipore syringe fil- ters. For SPE, 400ìl urine was spiked with (30-100 ìl) of solution B and (12-140 ìl) of solution A and completed to 2 mls with water (1:4 dilution) to pre- pare spiked urine samples of concentrations (150- 7000 ng.ml-1). C18 extraction cartridges were con- ditioned with 1 ml methanol, then 1 ml water, then urine sample was loaded, then washed with water and the drugs were eluted with 2 mls acetonitrile and then filtered through 0.2 µm millipore syringe filters. METHOD VALIDATION HPLC-DAD Linearity Aqueous mixture: Different aliquots of the work- ing standard solution A & B were transferred, sepa- rately, into 50-ml volumetric flasks, diluted to vol- ume with mobile phase to obtain concentrations of (50-10000) ng.ml-1 for the mentioned drugs. The so- lutions were filtered through 0.2 µm millipore sy- ringe filters. In plasma: The reconstituted solutions prepared in 2.4.1., having concentrations in a range of (100 - 10000 ng.ml-1) for the drugs mixture were filtered through 0.2 µm millipore syringe filters. In urine: The spiked urine samples, previously treated either with SPE (concentration 150-7000 ng.ml-1) or direct dilution (concentration 50-5000 ng.ml-1) prepared in 2.4.2., filtered through 0.2 µm millipore syringe filters. A 10 µl volume of each solution was injected, in triplicates, and the drugs were separated and quan- tified, using the above mentioned chromatographic conditions and the average peak areas were calcu- lated. The calibration curves, corresponding the re- Analytical Analytical CHEMISTRY Analytical Analytical CHEMISTRY An Indian Journal
Simultaneous analysis of doping drugs in human plasma and urine using HPLC- DAD . 24 ACAIJ, 16(1) 2016 Full Paper Full Paper TABLE 1: List of prohibited substances and methods 2006 established by world anti-doping agency (WADA)1 tions for the seven investigated drugs were then com- puted. Accuracy S1. Anabolic agents The previously mentioned procedure, under 3.1.1. was repeated for the analysis of different con- centrations of the pure investigated drugs mixture, their mixture in plasma, in urine by SPE and direct dilution. The concentrations were calculated, using the corresponding regression equation and the per- centage recoveries were then calculated as shown in TABLES (2-8). Precision Repeatability (intraday precision) 1a. Exogenous anabolic steroids 1b. Endogenous anabolic steroids Other anabolic agents S2. Hormones and related substances S3. S4. Agents with anti-estrogenic activity -Agonists S5. Diuretics and another masking agents M1. Enhancement of oxygen transfer The intraday variation was evaluated by apply- ing the previously mentioned procedure under 3.1.1. for analysis 150, 500 and 1000 ng.ml-1 for HCTZ, SAL and 200, 500 and 1000 ng.ml-1 for the rest of drugs (n = 6). It is applied for the analysis concentration 200, 1000 and 1500 ng.ml-1 for all drugs in plasma ex- cept for BMS 1000, 2000 and 7000 ng.ml-1, per- formed as triplicates in plasma. It is applied for the analysis concentration 250, 1000 and 3000 ng.ml-1 for TEST, SPIRO and 250,500,2000 ng ml-1 for FUR, 250,1500 and 3000 for IDP and 500,2000 and 6000 for BMS performed, performed as triplicates in urine after SPE. M2. Chemical and physical manipulation M3. Gene doping S6. Stimulants S7. Narcotics S8. Cannabinoids S9. Glucocorticosteroids P1. Alcohol P2. -Blockers lationship between average peak areas and their con- centrations were plotted and the regression equa- TABLE 2 : Accuracy of the proposed HPLC method for the analysis of pure samples of HCTZ, SAL, FUR, IDP, TEST, SPIRO and BMS HCTZ Found (ng ml-1) 49.55 59.87 69.42 79.47 89.26 150.12 502.95 SAL Found (ng ml-1) 49.66 59.66 69.39 99.69 148.99 200.56 502.05 FUR Found (ng ml-1) 49.72 59.81 69.83 99.52 IDP Found (ng ml-1) 49.55 59.91 69.91 99.72 Taken (ng ml-1) 50.00 60.00 70.00 80.00 90.00 150.00 500.00 1000.00 991.30 10000.00 9964.00 Mean ± S.D. *Average of three determinations % Taken (ng ml-1) 50.00 60.00 70.00 100.00 150.00 200.00 500.00 1000.00 998.80 10000.00 9957.00 Mean ± S.D. % Taken (ng ml-1) 50.00 60.00 70.00 100.00 200.00 199.16 300.00 298.29 500.00 497.45 700.00 697.27 1000.00 998.50 Mean ± S.D. % Taken (ng ml-1) 50.00 60.00 70.00 100.00 200.00 198.24 300.00 300.57 500.00 497.60 700.00 697.06 1000.00 999.50 Mean ± S.D. % Recovery* 99.10 99.78 99.17 99.34 99.18 100.08 100.59 99.13 99.64 Recovery* 99.32 99.43 99.13 99.69 99.33 100.28 100.41 99.88 99.57 Recovery* 99.44 99.68 99.76 99.52 99.58 99.43 99.49 99.61 99.85 Recovery* 99.10 99.85 99.87 99.72 99.12 100.19 99.52 99.58 99.95 99.56 ± 0.52 99.67 ± 0.44 99.59 ± 0.14 99.66 ± 0.37. Analytical Analytical CHEMISTRY Analytical Analytical CHEMISTRY An Indian Journal
ACAIJ, 16(1) 2016 Naglaa Ebrahim et al. 25 Full Paper Full Paper TABLE 3: Accuracy of the proposed HPLC method for the analysis of pure samples of HCTZ, SAL, FUR, IDP, TSE, SPIRO and BMS (cont’d) TSE Found (ng ml-1) % Recovery* 50.42 60.70 69.37 100.69 201.54 498.00 698.81 999.60 100.25 ± 0.72 SPIRO Found (ng ml-1) % Recovery* 99.58 198.78 299.37 498.60 698.88 1002.21 99.76 ± 0.28 FUR Found (ng ml-1) % Recovery* 100.87 198.58 498.20 698.67 997.32 9995.42 99.88 ± 0.53 Taken (ng ml-1) 50.00 60.00 70.00 100.00 200.00 500.00 700.00 1000.00 Mean ± S.D. *Average of three determinations Taken (ng ml-1) 100.00 200.00 300.00 500.00 700.00 1000.00 Mean ± S.D. Taken (ng ml-1) 100.00 200.00 500.00 700.00 1000.00 10000.00 Mean ± S.D. 100.84 101.17 99.10 100.69 100.77 99.60 99.83 99.96 99.58 99.39 99.79 99.72 99.84 100.22 100.87 99.29 99.64 99.81 99.73 99.95 TABLE 4 : Determination of human plasma samples spiked with HCTZ, SAL, FUR, IDP, TSE, SPIRO and BMS using the proposed HPLC method HCTZ Found (ng ml-1) 98.68 SAL Found (ng ml-1) 98.32 FUR Found (ng ml-1) IDP Found (ng ml-1) 98.51 Taken (ng ml-1) 100.00 200.00 196.46 300.00 294.72 500.00 495.10 2000.00 2014.40 4000.00 3982.40 5000.00 4979.50 8000.00 7920.80 9000.00 8996.40 Mean ± S.D. *Average of three determinations % Taken (ng ml-1) 100.00 200.00 200.86 600.00 588.96 800.00 785.68 1000.00 1014.82 1200.00 1215.24 2000.00 1992.03 4000.00 3982.41 8000.00 7938.42 9000.00 8946.90 Mean ± S.D. % Taken (ng ml-1) 100.00 101.56 200.00 202.72 300.00 296.25 1500.00 1513.81 1600.00 1598.24 1800.00 1800.90 Mean ± S.D. % Taken (ng ml-1) 100.00 200.00 197.22 300.00 304.20 400.00 405.68 2000.00 2021.00 5000.00 5030.50 Mean ± S.D. % Recovery* 98.68 98.23 98.24 99.02 100.72 99.56 99.59 99.01 99.96 Recovery* 98.32 100.43 98.16 98.21 101.48 101.27 99.60 99.56 99.23 99.41 Recovery* 101.56 101.36 98.75 100.92 99.89 100.05 Recovery* 98.51 98.61 101.40 101.42 101.05 100.61 99.22 ± 0.82 99.57 ± 1.19 100.42 ± 1.06 100.27 ± 1.35 TABLE 5 : Determination of human plasma samples spiked with HCTZ, SAL, FUR, IDP, TSE, SPIRO and BMS using the proposed HPLC method (cont’d) FUR Found (ng ml-1) 98.05 197.86 296.22 992.33 1797.84 SPIRO Found (ng ml-1) 203.04 505.20 609.72 785.92 989.93 2007.41 2980.82 8016.04 8989.22 IDP Found (ng ml-1) 982.34 1771.38 1975.82 2968.83 7937.61 8954.13 Taken (ng ml-1) 100.00 200.00 300.00 1000.00 1800.00 % Taken (ng ml-1) 200.00 500.00 600.00 800.00 1000.00 2000.00 3000.00 8000.00 9000.00 Mean ± S.D. % Taken (ng ml-1) 1000.00 1800.00 2000.00 3000.00 8000.00 9000.00 % Recovery* 98.05 98.93 98.74 99.23 99.88 Recovery* 101.52 101.04 101.62 98.24 98.99 100.37 99.36 100.20 99.88 Recovery* 98.23 98.41 98.79 98.96 99.22 99.49 Mean ± S.D. 98.97 ± 0.67 Mean ± S.D. 98.85 ± 0.48 100.14 ± 1.15 *Average of three determinations Analytical Analytical CHEMISTRY Analytical Analytical CHEMISTRY An Indian Journal
Simultaneous analysis of doping drugs in human plasma and urine using HPLC- DAD . 26 ACAIJ, 16(1) 2016 Full Paper Full Paper TABLE 6 : Determination of human urine samples spiked with HCTZ and SAL after direct dilution using the proposed HPLC method HCTZ Found (ng ml-1) 153.47 253.81 2029.20 2982.93 3980.84 5049.51 SAL Taken (ng ml-1) 150.00 250.00 2000.00 3000.00 4000.00 5000.00 Taken (ng ml-1) 50.00 100.00 150.00 250.00 300.00 400.00 500.00 1500.00 2000.00 5000.00 Mean ± S.D. Found (ng ml-1) 51.32 102.54 153.71 244.71 293.61 393.56 492.22 1488.63 1980.20 5019.00 % Recovery* 102.31 101.52 101.46 99.43 99.52 100.99 % Recovery* 102.64 102.54 102.47 97.88 97.87 98.39 98.44 99.24 99.01 100.38 Mean ± S.D. 100.87 ± 1.16 99.89 ± 1.98 *Average of three determinations TABLE 7 : Determination of human urine samples spiked with FUR using the proposed HPLC method using SPE and direct dilution FUR Through SPE Found (ng ml-1) 245.03 286.71 387.76 486.05 951.54 2030.22 2972.70 Through direct dilution Found (ng ml-1) 153.12 245.08 699.93 1006.91 Taken (ng ml-1) 250 300 400 500 1000 2000 3000 Mean ± S.D. *Average of three determinations Taken (ng ml-1) 150 250 700 1000 % Recovery* 98.01 95.57 96.94 97.21 95.15 101.51 99.09 97.64 ± 2.17 % Recovery* 102.08 98.03 99.99 100.69 1500 1491.60 99.44 Mean ± S.D. 100.05 ± 1.49 TABLE 8 : Determination of human urine samples spiked with IDP using the proposed HPLC method using SPE and direct dilution Through SPE Found (ng ml-1) 156.95 243.75 385.96 489.45 1489.52 3986.41 5034.00 5977.23 Through direct dilution Found (ng ml-1) 51.21 99.51 146.49 245.61 391.72 492.80 700.14 988.53 1481.25 1989.82. 3968.81 5033.00 Taken (ng ml-1) 150 250 400 500 1500 4000 5000 6000 Mean ± S.D. Taken (ng ml-1) 50 100 150 250 400 500 700 1000 1500 2000 4000 5000 Mean ± S.D. % Recovery* 104.63 97.50 96.49 97.89 99.30 99.66 100.68 99.62 % Recovery* 102.42 99.51 97.66 98.24 97.93 98.56 100.02 98.85 98.75 99.49 99.22 100.66 99.47 ± 2.49 99.28 ± 1.31 *Average of three determinations Analytical Analytical CHEMISTRY Analytical Analytical CHEMISTRY An Indian Journal
ACAIJ, 16(1) 2016 Naglaa Ebrahim et al. 27 Full Paper Full Paper drugs (n = 6). It is applied for the analysis concentration 200, 1000 and 1500 ng.ml-1 for all drugs in plasma ex- cept for BMS 1000, 2000 and 7000 ng.ml-1, per- formed as triplicates in plasma. It is applied for the analysis concentration 250, 1000 and 3000 ng.ml-1 for TEST, SPIRO and 250,500 and 2000 ng.ml-1 for FUR, 250,1500 and 3000 ng.ml- 1 for IDP and 500,2000 and 6000 for BMS performed, performed as triplicates in urine after SPE. It is applied for the analysis concentration 250, 500 and 1500 ng.ml-1 for FUR and 250, 1000 and 3000 ng.ml-1 for the rest of drugs performed as trip- licates in urine after direct dilution. It is applied for the analysis concentration 250, 500 and 1500 ng.ml-1 for FUR and 250, 1000 and 3000 ng.ml-1 for the rest of drugs performed as trip- licates in urine after direct dilution. The concentrations were calculated using the corresponding regression equation and the percent- age recoveries and standard deviations were then calculated as shown in TABLES (9-12). Intermediate precision (interday precision) The interday variation was evaluated by apply- ing the previously mentioned procedure under 3.1.1. for analysis 150, 500 and 1000 ng.ml-1 for HCTZ, SAL and 200, 500 and 1000 ng. ml-1 for the rest of TABLE 9 : Determination of human urine samples spiked with TEST using the proposed HPLC method using SPE and direct dilution Through SPE Found (ng ml-1) 163.02 243.40 288.33 398.64 513.15 1510.05 4000.81 6033.63 6999.32 Through direct dilution Found (ng ml-1) 52.29 103.24 146.89 245.88 293.04 388.08 2001.81 3999.20 5077.00 Taken (ng ml-1) 150 250 300 400 500 1500 4000 6000 7000 Mean ± S.D. *Average of three determinations Taken (ng ml-1) 50 100 150 250 300 400 2000 4000 5000 Mean ± S.D. % Recovery* 108.68 97.36 96.11 99.66 102.63 100.67 100.02 100.56 99.99 % Recovery* 104.58 103.24 97.93 98.35 97.68 97.02 100.09 99.98 101.54 100.63 ± 3.56 100.05 ± 2.62 TABLE 10 : Determination of human urine samples spiked with SPIRO using the proposed HPLC method using SPE and direct dilution Through direct dilution Found (ng ml-1) 104.72 151.37 243.03 303.69 396.48 702.31 2010.60 2939.74 Through SPE Found (ng ml-1) 161.99 244.23 306.84 416.00 486.95 1508.41 1959.83 3988.42 6019.80 6990.94 Taken (ng ml-1) Taken (ng ml-1) 100 150 250 300 400 700 2000 3000 5000 % Recovery* 107.99 97.69 102.28 104.00 97.39 100.56 97.99 99.71 100.33 99.87 % Recovery* 104.72 100.91 97.21 101.23 99.12 100.33 100.53 97.99 100.72 150 250 300 400 500 1500 2000 4000 6000 7000 5036.00 Mean ± S.D. 100.78 ± 3.26 Mean ± S.D. 100.31 ± 2.16 *Average of three determinations Analytical Analytical CHEMISTRY Analytical Analytical CHEMISTRY An Indian Journal
Simultaneous analysis of doping drugs in human plasma and urine using HPLC- DAD . 28 ACAIJ, 16(1) 2016 Full Paper Full Paper TABLE 11 : Determination of human urine samples spiked with BMS using the proposed HPLC method using SPE and direct dilution Through SPE Found (ng ml-1) 140.72 271.20 295.32 419.96 519.91 1997.00 2998.84 3986.83 6000.62 6998.61 Through direct dilution Found (ng ml-1) 146.59 246.18 305.67 395.00 498.95 694.96 987.41 2994.93 3995.60 4944.11 Taken (ng ml-1) 150 250 300 400 500 2000 3000 4000 6000 7000 Mean ± S.D. *Average of three determinations Taken (ng ml-1) 150 250 300 400 500 700 1000 3000 4000 5000 Mean ± S.D. % Recovery* 93.81 108.48 98.44 104.99 103.98 99.85 99.96 99.67 100.01 99.98 % Recovery* 97.73 98.47 101.89 98.75 99.79 99.28 98.74 99.83 99.89 98.88 100.92 ± 4.02 99.33 ± 1.13 TABLE 12 : Results of assay validation parameters of the proposed HPLC method for the determination of the seven pure drugs Parameter Retention time Linearity (ng ml-1) Slope Standard error of slope Confidence limit of slope Intercept Confidence limit of intercept Correlation coefficient Standard error of estimation LOD LOQ Repeatabilitya (SDr) 99.93 ± 0.74 99.87 ± 0.54 Intermediate precisionb (SDint) Accuracy± S.D. 99.56 ± 0.52 99.67 ± 0.44 HCTZ 5.20 ± 0.24 50 – 10000 115.41 SAL 6.3 ± 0.26 50 – 10000 82.17 FUR IDP TEST SPIRO BMS 8.00 ± 0.31 9..50 ± 0.19 13.07 ± 0.40 18.50 ± 0.29 26.00 ± 0.39 50 – 1000 50 – 1000 50 – 1000 321.92 154.87 138.68 100–1000 135.89 100 – 10000 31.48 0.88 0.58 2.08 0.68 0.93 1.11 0.19 113.33 ---- 117.49 20544.14 13575.34 --- 27512.94 80.80 ---- 83.55 7024.96 2421.01 ----- 11628.91 317.01— 326.82 -3285.81 -1036.73 ---- -5534.9 153.27---- 156.47 -574.77 -1307.29 --- 157.74 136.40 --- 140.96 -4996.83 -6077.25 ---- -3916.42 132.82 --- 138.98 -6874.57 -8597.14 ---- -5152.00 30.97 --- 32.00 4291.72 2158.42 --- 6425.02 0.9997 0.9998 0.9998 0.9999 0.9998 0.9998 0.9999 8113.09 5349.14 1973 642.66 884.41 839.24 1623.58 15.08 45.68 14.58 44.18 14.05 42.58 14.42 43.69 15.99 48.45 28.55 86.52 30.17 91.42 99.64 ± 0.19 99.53 ± 0.42 100.11 ± 0.59 99.78 ± 0.42 99.55 ± 0.23 99.87 ± 0.62 99.72 ± 0.69 99.29 ± 0.32 99.29 ± 0.25 100.41 ± 0.89 99.42 ± 0.39 99.33 ± 0.12 99.59 ± 0.14 99.66 ± 0.37 100.25 ± 0.72 99.76 ± 0.28 99.88 ± 0.53 a The intraday and b the interday relative standard deviations of samples of concentration 150, 500, 1000 ng ml-1 for HCTZ , SAL and 200, 500, 1000 ng ml-1 for each of FUR, IDP, TEST, SPIRO and BMS performed as triplicates The concentrations were calculated using the cor- responding regression equation and the percentage recoveries and standard deviations were then cal- culated as shown in TABLES (9-12). Selectivity A Laboratory prepared mixture of the seven drugs were prepared at a concentration of 10 µg.ml- 1 of each drug, filtered through 0.2 ìm filter, then 10-µl volume of the resultant solution was injected in triplicates, and determined, using the chromato- graphic conditions described under 3.1.1. and aver- age peak area for each was calculated. Concentra- tions were calculated, using the corresponding re- Analytical Analytical CHEMISTRY Analytical Analytical CHEMISTRY An Indian Journal
ACAIJ, 16(1) 2016 Naglaa Ebrahim et al. 29 Full Paper Full Paper gression equation and the percentage recoveries. Limit of detection and limit of quantitation The lowest detectable concentrations of the seven drugs, either in pure form or in spiked plasma and urine were determined by applying the previ- ously mentioned chromatographic conditions under 3.1.1. as shown in TABLES (9-12). The USP guide- line for determination of LOD and LOQ was fol- lowed. The estimation based on the standard devia- tion of response. LOD and LOQ are, thus; LOD = 3.3 × ó / S LOQ = 10 × ó / S Where; ó is the standard deviation of response and S is the slope. Here, the standard deviation of the y- intercepts of the regression lines can be used as the standard deviation of response. the advantage of rapid analysis and reduction of con- sumed solvents. Calibration curves for each of the investigated drugs, either in pure form or in plasma and urine were constructed, representing the rela- tionship between the calculated average peak areas and the corresponding concentrations and the regres- sion equations were computed as shown in TABLES (9-12). In plasma; the high selectivity of the proposed method allowed simultaneous quantitative determi- nation of the seven investigated diuretics. Its high selectivity and sensitivity permits its use for quanti- tative analysis in human plasma for antidoping pur- pose. The sample pretreatment step was essential to remove plasma proteins that clog membrane filter and contaminate the column. The aim was to obtain the highest possible recovery, while using the sim- plest available extraction procedures. A rapid pro- cedure is to mix the biological fluid with at least two volumes of methanol or acetonitrile causing pro- tein precipitation[19]. We tried methanol, acetonitrile or a mixture1:1, but we found that, acetonitrile is more effective, given clean chromatograms for the blank plasma samples at the specified retention times of the drugs. The results of assay validation are pre- sented in TABLE (10). The roles of measurements and the limits for ac- ceptance are given by pharmacopoeia[20]. From these data, one can conclude that; the proposed method meets all criteria for pharmaceutical analysis. The results of the system suitability tests shown in TABLE (13) assured the adequacy of the proposed HPLC method for simultaneous analysis of the dop- ing drugs either in pure form, plasma and urine. It should be noted that; we obtain system suitability parameters for each drug at the wavelength showing maximum sensitivity. The run time was 27 mins, which offers an advantage of rapid analysis and re- duction of the consumed solvents. In bioanalysis, many substances (endogenous substances, metabolites, degradation products, co- administrated drugs, etc.) can potentially interfere in the determination of the analytes of interest. The extent of the specificity experiments is mainly de- termined by the application of the method, it should RESULTS AND DISCUSSION A RP-HPLC method was suggested for simulta- neous quantitative determination of HCTZ, SAL, FUR, IDP, TSE, SPIRO and BMS in pure form and in spiked human plasma and urine. The proposed method is based on the difference in retention times between the investigated drugs. The specified chromatographic conditions were adjusted; a 10-µl volume was injected into HPLC. Several mobile phases were tried to obtain satis- factory results, good separation of the doping drugs, symmetric peak shape and short run time. The best results were obtained upon using mo- bile phase acetonitrile : phosphoric acid at pH 3 (50:50, v/v) with a flow rate 1 ml.min-1 at wave- lengths 225, 272, 235, 242, 244 and 239 nm for the drugs’ mixture. It was found that pH 3 was optimum for good separation; also on slight change in the mobile phase pH shows no significant difference. These wavelengths were chosen according to the maximum wavelengths (ëmax) or the wavelengths that show maximum sensitivity for the studied drugs. The advantage of using DAD is that we can obtain a maxi- mum sensitivity with minimum interference through choosing the ëmax for each drug as the running wave- length upon its determination in the mixture. The retention times, shown in TABLE (9), offer Analytical Analytical CHEMISTRY Analytical Analytical CHEMISTRY An Indian Journal
Simultaneous analysis of doping drugs in human plasma and urine using HPLC- DAD . 30 ACAIJ, 16(1) 2016 Full Paper Full Paper TABLE 13 : Results of assay validation parameters of the proposed HPLC method for the determination of the seven drugs in spiked human plasma Parameter HCTZ SAL FUR IDP TEST 13.22 ± 0.45 SPIRO BMS Retention time 5.31 ± 0.40 6.40 ± 0.39 8.20 ± 0.35 9.65 ± 0.25 18.65 ± 0.32 26.11 ± 0.21 Linearity (ng ml-1) 100 – 9000 Slope Standard error of slope Confidence limit of slope Intercept Confidence limit of intercept Correlation coefficient Standard error of estimation LOD LOQ Repeatabilitya (SDr) Intermediate precisionb (SDint) 100 – 9000 135.09 100 – 1800 462.11 100 – 5000 100 – 1800 168.85 200–9000 100.46 1000 – 9000 46.41 267.67 188.28 1.69 1.41 5.01 2.69 0.94 1.10 0.67 263.66 ---- 271.68 20903.02 2452.24--- 39353.79 131.83 ---- 138.35 23602.16 10218.97 ---- - 36985.34 448.19— 476.03 30479.68 14218.14 ---- 46741.22 161.36---- 176.34 26227.59 9682.80 --- 42772.39 185.29 --- 191.27 3756.64 958.68 ---- -6554.59 97.86 --- 103.07 -17535.76 -28522.16 --- - -6549.36 44.54 --- 48.28 11676.66 -21392.88 --- -1960.45 0.9998 0.9995 0.9997 0.9995 0.9999 0.9996 0.9996 16648.10 13862.43 8895.01 11640.17 1350.84 10461.13 5201.31 31.16 94.42 29.99 90.88 28.14 85.27 29.84 90.42 31.98 96.91 99.19 ± 0.25 99.06 ± 0.39 98.97 ± 0.67 28.55 86.52 250.99 760.58 99.36 ± 1.47 101.06 ± 0.55 100.30 ± 1.47 98.52 ± 0.14 100.13 ± 1.28 98.79 ± 0.57 99.58 ± 1.54 101.15 ± 0.25 100.30 ± 1.57 98.34 ± 0.11 100.22 ± 1.51 98.61 ± 0.56 100.27 ± 1.35 Accuracy± S.D. 99.22 ± 0.82 99.57 ± 1.19 100.42 ± 1.06 100.14 ± 1.15 98.85 ± 0.48 a The intraday and b the interday relative standard deviations of samples of concentration 200, 1000, 1500 ng ml-1 for HCTZ , SAL, FUR, IDP, TEST, SPIRO and 1000, 2000,7000 ng ml-1 for BMS performed as triplicates TABLE 14 : Results of assay validation parameters of the proposed HPLC method for the determination of the five drugs in spiked human urine through SPE Parameter Retention time Linearity (ng ml-1) Slope Standard error of slope Confidence limit of slope Intercept Confidence limit of intercept Correlation coefficient Standard error of estimation LOD LOQ Repeatabilitya (SDr) Intermediate precisionb (SDint) Accuracy± S.D. FUR IDP TEST 12.99 ± 0.45 150 – 7000 72.29 0.54 SPIRO 18.11 ± 0.30 150–7000 62.83 0.54 BMS 7.99 ± 0.25 250 – 3000 218.19 2.43 9.35 ± 0.35 150 – 6000 101.52 0.69 25.55 ± 0.39 150 – 7000 35.63 0.26 211.95— 224.44 99.84---- 103.21 71.01 --- 73.57 61.58 --- 64.08 35.03 --- 36.24 80495.71 71487.19 ---- 89504.22 0.9997 24964.03 19647.75 --- 30280.31 0.9998 23148.94 18814.23 ---- 27483.64 0.9998 16745.53 12649.79 ---- 20841.27 0.9997 8637.39 6586.41 --- 10688.37 0.9998 6257.87 4359.85 4143.53 4154.29 2016.29 70.11 212.45 98.96 ± 2.23 39.15 118.64 98.71 ± 1.05 42.71 129.42 98.31 ± 0.82 45.91 139.12 98.18 ± 0.47 49.01 148.52 101.28 ± 2.34 99.11 ± 2.49 99.07 ± 1.82 98.11 ± 0.46 97.77 ± 0.74 101.84 ± 2.87 97.64± 2.17 99.47 ± 2.49 100.63 ± 3.56 100.78 ± 3.26 100.92 ± 4.01 a The intraday and b the interday relative standard deviations of samples of concentration 250, 1000, 3000 ng ml-1 for TEST, SPIRO and 250,500,2000 ng ml-1 for FUR, 250,1500, 3000 for IDP and 500,2000,6000 for BMS performed as triplicates Analytical Analytical CHEMISTRY Analytical Analytical CHEMISTRY An Indian Journal
ACAIJ, 16(1) 2016 Naglaa Ebrahim et al. 31 Full Paper Full Paper TABLE 15 : Results of assay validation parameters of the proposed HPLC method for the determination of the seven drugs in spiked human urine through direct dilution Parameter HCTZ SAL FUR IDP TEST SPIRO BMS 25.68 ± 0.35 Retention time 4.88 ± 0.40 6.00 ± 0.38 7.91 ± 0.34 9.30 ± 0.40 12.85 ± 0.38 18.00 ± 0.28 Linearity (ng ml-1) Slope Standard error of slope Confidence limit of slope Intercept Confidence limit of intercept Correlation coefficient Standard error of estimation LOD LOQ 150 – 5000 138.89 50 – 5000 77.75 150 – 1500 168.25 50 – 5000 69.69 50 – 5000 56.24 100–5000 150 – 5000 50.49 22.05 2.10 0.86 2.81 0.56 0.64 0.36 0.17 133.05 ---- 144.74 57428.54 39887.22--- 74969.85 75.77 ---- 79.73 25255.74 21721.13 ----- 28790.36 159.31— 177.19 55862.09 48037.09 ---- 63687.08 68.44---- 70.94 15081.16 12551.09 --- 17611.23 54.73 --- 57.74 12406.62 9027.96 ---- 15785.28 49.64 --- 51.35 3876.81 2104.76 ---- -5648.86 21.65 --- 22.45 1904.36 986.64 --- 2822.08 0.9995 0.9995 0.9996 0.9997 0.9995 0.9998 0.9997 9298.35 3967.84 3121.57 3009.99 3408.56 1733.94 933.72 39.41 119.42 11.98 36.30 35.52 107.64 12.70 38.48 14.11 42.76 29.01 87.91 40.72 123.39 99.01 ± 0.72 98.27 ± 0.79 99.33 ± 1.13 Repeatabilitya (SDr) 100.15 ± 0.99 98.81 ± 0.54 98.77 ± 0.71 98.90 ± 0.69 98.95 ± 0.52 99.19 ± 1.01 Intermediate precisionb (SDint) 99.99 ± 1.54 98.44 ± 0.34 98.55 ± 0.86 98.86 ± 0.46 98.73 ± 0.49 99.00 ± 0.94 Accuracy± S.D. 100.87 ± 1.16 99.89 ± 1.98 100.05 ± 1.49 99.28 ± 1.31 100.05 ± 2.62 100.31±2.16 aThe intraday and b the interday relative standard deviations of samples of concentration 250, 500, 1500 ng ml-1 for FUR and 250,1000,3000 ng ml-1 for the rest of drugs performed as triplicates TABLE 16 : System suitability parameters for the analysis of the seven drugs using the proposed HPLC method Parameter HCTZ 0.75 1 4900 1.49 4 SAL 1.12 1.02 7168.44 1.49 5.08 FUR 1.67 1 11377.78 1.32 5.33 IDP 2.2 1 TEST 3.36 1 30368.87 1.55 14.88 SPIRO 5.22 1 34782.25 1.47 16.33 BMS 7.67 1 43264.00 1.47 16.33 Capacity factor (K) Tailing factor (T) Number of theoretical plates (N) Selectivity* (á) Resolution** (R) * Selectivity was calculated according to the capacity factors of two successive peaks; ** Resolution was calculated according to the retention times of the drugs in two successive peaks 12037.22 1.53 7.71 be noted that ICH makes no difference between the terms ‘selectivity’ and ‘sensitivity’. Several valida- tion documents[22, 23, 24] require different sources of blank matrices to be analyzed. One must demonstrate that there is no interference in the chromatographic region of the analytes. The proposed method was tested for specificity by comparing chromatograms of 3 different sources of blank human plasma. The chromatograms were free from any interfering peaks at the retention times of the studied drugs. Thus the proposed method can be used for quantitative determination of the seven drugs in plasma, i.e. for antidoping purpose without interference by endogenous plasma components. The spiked human plasma samples stored at -20 °C, were injected over a period of 1 month did not suffer any appreciable changes in the assay values and were able to meet the criteria mentioned above. Hence, the samples were stable during 1 month. In addition, the drugs mixture was found to be stable in human plasma and the stability is maintained at room temperature for more than 12 hours. The extraction efficiency was verified by the ac- curacy of the proposed method showing in TABLE Analytical Analytical CHEMISTRY Analytical Analytical CHEMISTRY An Indian Journal
Simultaneous analysis of doping drugs in human plasma and urine using HPLC- DAD . 32 ACAIJ, 16(1) 2016 Full Paper Full Paper (1) (2) (3) (4) (5) (6) (7) Figure 1 : Chemical structures of the studied doping drugs (1) Hydrochlorothiazide (HCTZ) (2) Salbutamol (SAL) (3) Furosmide (FUR) (4) Indapamide (IDP) (5) Testosterone (TSE) (6) Spironolactone (SPIRO) (7) Betamethasone (BMS) Figure 2 : Chromatogram showing simultaneous separation of the seven drugs (10ìg ml-1) at ë225 nm Figure 3 : Chromatogram showing simultaneous separation of the seven drugs (10ìg ml-1) at ë272 nm Analytical Analytical CHEMISTRY Analytical Analytical CHEMISTRY An Indian Journal
ACAIJ, 16(1) 2016 Naglaa Ebrahim et al. 33 Full Paper Full Paper Figure 4 : Chromatogram showing simultaneous separation of the seven drugs (10ìg ml-1) at ë235 nm Figure 5 : Chromatogram showing simultaneous separation of the seven drugs (10ìg ml-1) at ë242 nm Figure 6 : Chromatogram showing simultaneous separation of the seven drugs (10ìg ml-1) at ë244 nm Figure 7 : Chromatogram showing simultaneous separation of the seven drugs (10ìg ml-1) at ë239 nm Analytical Analytical CHEMISTRY Analytical Analytical CHEMISTRY An Indian Journal
Simultaneous analysis of doping drugs in human plasma and urine using HPLC- DAD . 34 ACAIJ, 16(1) 2016 Full Paper Full Paper Figure 8 : Chromatogram of blank plasma at ë225 nm Figure 9 : Chromatogram of plasma spiked with the seven drugs (each of 2000 ng ml-1) at ë225 nm Figure 10 : Chromatogram of blank urine after SPE at ë244 nm Figure 11 : Chromatogram of urine spiked with the seven drugs at ë244 nm after SPE (3), while results of assay validation of the seven drugs are illustrated in TABLES (10). In urine, the background signal of urine samples, due to the proteins (wide band at the head of the Analytical Analytical CHEMISTRY Analytical Analytical CHEMISTRY An Indian Journal
ACAIJ, 16(1) 2016 Naglaa Ebrahim et al. 35 Full Paper Full Paper [10] R.Berges, J.Segura, X.De La Torre, R.Ventura; “J.Chromatogr.B Biomed.Sci.Appl.”, 723, 173 (1999). [11] H.Striegel, D.Rossner, P.Simon, A.M.Niess; “Int.J.Sports Med.”26, 238 (2005). [12] V.Wynn; “Br J Sports Med”, 9, 60–4 (1975). [13] C.Saudan, N.Baume, N.Robinson, L.Avois, P.Mangin, M.Saugy; “Br J Sports Med”, 40, i21– i24 (2006). [14] A.Mozayani, L.Raymon; “Handbook of Drug In- teractions: Clinical and Forensic Guide”, Chapter 15: Anabolic Doping Agents, Springer, (2012). [15] E.Pujos, M.M.Flament-Waton, O.Paisse, M.F.Grenier-Loustalot; “Anal Bioanal Chem.”, 381, 244–254 (2005). [16] K.Deventer, F.T.Delbeke; “Rapid Commun.Mass Spectrom”, 17, 2107–2114 (2003). [17] WADA Technical Document TD2004MRPL (Mini- mum required performance limits for the detection of prohibited substances), World Anti-Doping Agency, Montreal, Canada, 2004 (also available on- line at www.wada-ama.org/rtecontent/document/perf limits 2.pdf, last accessed July 5, (2007). [18] WADA Technical Document TD2003IDCR (Iden- tification criteria for qualitative assays incorporating chromatography and mass spectrometry), World Anti-Doping Agency, Montreal, Canada, 2003 (also available on-line at www.wada-ama.org/rtecontent/ document/criteria 1 2.pdf, last accessed July 5, (2007). [19] S.Gorog, “Ultraviolet-visible spectrophotometry in pharmaceutical analysis”, CRC Press, Boca Raton, FL, (1995). [20] United states pharmacopoeia 30-NF 25th ed., United States Pharmacopoeial Convention, Rockville, MD 20852, United States, (2007). [21] D.Buhrman, P.Price “J.Am.Soc.Mass Spectrom.”, 7, 1099-1105 (1996). [22] V.Shah, K.Midha, S.Dighe, I.McGilverary, J.Skelly, A.Yacobi, T.Layloff, C.Viswanathan, C.Cook, R.McDowall, K.Pittman, S.Spector, “Pharmaceuti- cal Research”, 9, 588-592 (1992), Through Anal.Abstr.Online [23] P.De Biévre and H.Günzler, “Measurement Uncer- tainty in Chemical Analysis”, Springer, (2003). [24] C.Krishnaiah, A.R.Reddy, R.Kumar, K.Mukkanti; “J.Pharm.Biomed.Anal.”, 53, 483-489 (2010). chromatograms) and several endogenous compounds (peaks at diverse retention times), can seriously af- fect the detection of drugs. Also, direct injection without dilution or pretreatment may harm the col- umn, cause bacterial growth, damage the packing material thus shortening the life of the column or can force frequent regeneration of the stationary phase. Both direct dilution and SPE were validated and compared. It was found that SPE (1:4dilution) more sensitive than direct dilution (1:50 dilution), how- ever HCTZ and SAL produced irreproducible re- sults because of their hydrophilicity. The pretreat- ment efficiency was verified by the accuracy of the proposed method showing in TABLE (4-8), while results of assay validation of the seven drugs are illustrated in TABLES (11,12). The proposed HPLC method was applied for si- multaneous determination of the four diuretics in spiked human plasma. REFERENCES [1] World anti-doping agency, The World Anti-Doping Code, 2006 Prohibited list. www.wada-ama.org(last accessed September, (2006). [2] World anti-doping agency, The world anti-doping code, Minimum required performance limits for de- tection of prohibited substances, www.wada-ama.org (last accessed September, (2006). [3] World anti-doping agency, The world anti-doping code, International Standards for Laboratories, ver- sion 4.0, August 2004, www.wada-ama.org (last ac- cessed September, (2006). [4] L. Rivier; “Anal.Chim.Acta”, 492, 69–82 (2003). [5] Olympic movement anti-doping code, Prohibited classes of substances and prohibited methods, IOC, Lausanne, Appendix A, (2001). [6] S.F.Cooper, R.Masse, R.Dugal; “J.Chromatogr”, 489, 65–88 (1989). [7] H.J.Guchelaar, L.Chandi, O.Schouten, W.A.Van Den Brand; “Fresenius J.Anal.Chem.”, 363, 700–705 (1999). [8] B.C.Sporer, PhD, A.W.Sheel, J.Taunton, MD, J.L.Rupert, D.C.McKenzie; “Clin J Sport Med” 18, (2008). [9] M.I.Saleh, Y.M.Koh, S.C.Tan, A.L.Aishah; “Ana- lyst”, 125, 1569–1572 (2000). and P.Rudewicz, Analytical Analytical CHEMISTRY Analytical Analytical CHEMISTRY An Indian Journal