Indycar Telemetry Data Acquisition Interface
Indycar Telemetry Data Acquisition Interface. University of Waterloo Systems Design SD 542. Danny Ho 97 140232 March 25, 2002. Presentation Summary. Introduction to Telemetry Functional Decomposition Initial Design 1 st Prototype User Feedback & Limitations 2 nd Prototype

Indycar Telemetry Data Acquisition Interface
E N D
Presentation Transcript
Indycar TelemetryData Acquisition Interface University of Waterloo Systems Design SD 542 Danny Ho 97 140232 March 25, 2002
Presentation Summary • Introduction to Telemetry • Functional Decomposition • Initial Design • 1st Prototype • User Feedback & Limitations • 2nd Prototype • Industry Comparison • Conclusions
Objective of Telemetry • Ensure driver safety • Monitor vehicle performance • Use data history to adapt car to track 1st place finish !
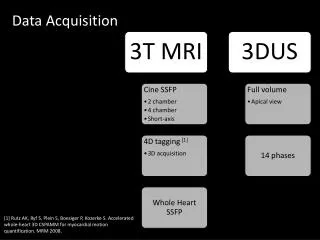
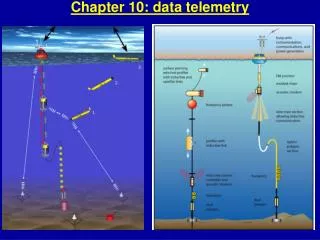
The Flow of Data Onboard sensors Radio transmitters Pit lane
Focus of 1st Interface • Functional Visual Basic for Application implementation • Simulate alarm conditions • Provide real-time monitoring scenario
User Feedback & Limitations • Alarm salience was adequate • Visual representation did not conform well to mental model • Graphical forms lacked frame of reference (scale) • Certain graphical elements were hard to notice
Conclusions • Proposed system: • offers richer, more iconic representation of data • Provides better cognitive association • Improves upon salience and mental model • Industry systems: • more data intense • data display in the strictest sense • targeted towards expert engineers (experienced!)
Q & A • How critical is alarming? • Shouldn’t experts know what to look at? • Analogical or Iconic? • Is industry software too bland?