Visual Air Quality
820 likes | 840 Views
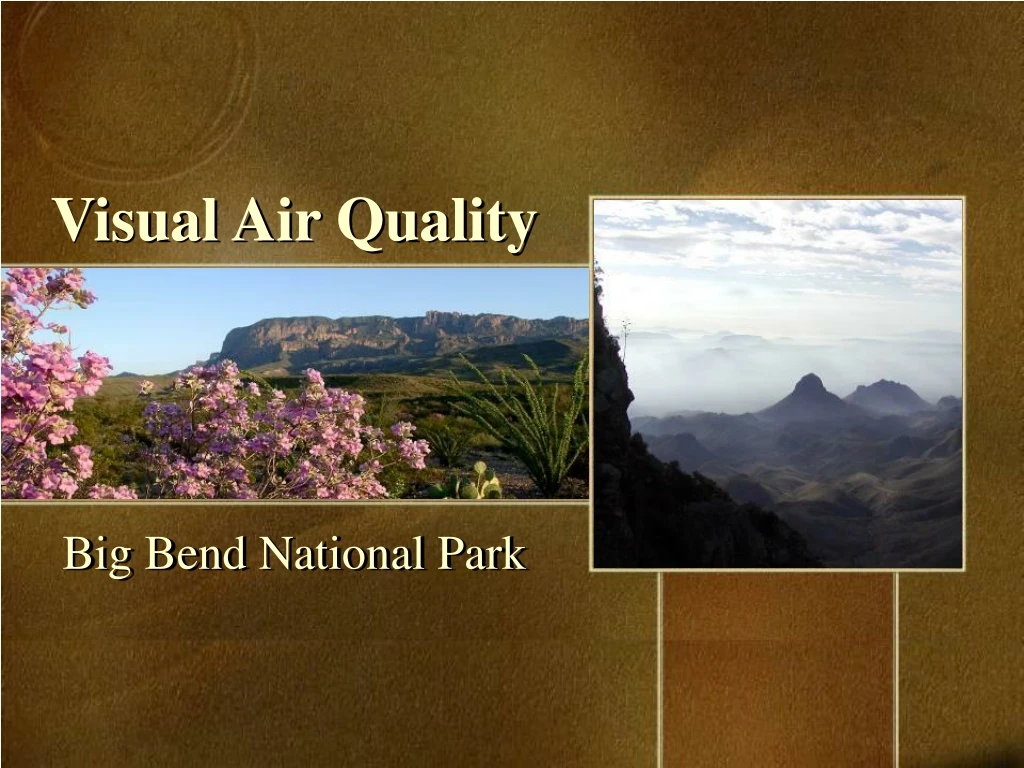
Big Bend National Park in Texas is known for its stunning panoramic views and unique border location. However, the park is also facing air pollution challenges, with haze frequently obscuring the picturesque scenery. This text explores the causes of the pollution and its impact on visibility, as well as the efforts of park managers to address the issue.

Visual Air Quality
E N D
Presentation Transcript
Visual Air Quality Big Bend National Park
Big Bend – A Land of Borders One of the largest and least-visited national parks, Big Bend encompasses over 800,000 acres in southwest Texas. Situated on the northern banks of the Rio Grande it is the meeting place of nations and cultures. Three states come together at Big Bend: Texas in the United States, and Coahuila and Chihuahua in Mexico. Because of it’s unique character, Big Bend was designated a Desert Biosphere Reserve in 1976. Big Bend Natl. Park
Big Bend – A Land of Panoramic Views South Rim View
Big Bend – A Land of Panoramic Views Casa Grande
Big Bend – A Land of Panoramic Views Juniper Canyon – The Boot
Big Bend – A Land of Panoramic Views Sierra Del Carmen Mountains - Mexico
Big Bend – A Land of Panoramic Views Chisos Basin
Visibility: Defining the Problem
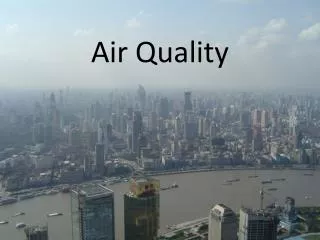
Big Bend – Air Pollution Although remote, Big Bend is not immune to urban problems like air pollution.
Big Bend – Air Pollution On many days, haze hangs over much of Big Bend’s landscape, obscuring the panoramic views many visitors seek.
Big Bend – Air Pollution On some days during the summer the park experiences the worst visibility of any western national park.
Views throughoutthe park are impacted to some degree most of the time. It’s Hazy and Getting Hazier Clear day Hazy day
Most visitors believe the haze is natural. It’s not. The primary cause is human activity. It’s Hazy and Getting Hazier Clear day Hazy day
Noticeable changes in air quality appeared around the turn of the century in many areas of the U.S. It’s Hazy and Getting Hazier Clear day Hazy day
Park managers began monitoring the air atBig Bendin 1978. It’s Hazy and Getting Hazier Clear day Hazy day
After years of data collection and analysis, researchers are begin-ning to understand what causes the pollution contributing to the park’s visibility problem and consider the sources both near and distant. It’s Hazy and Getting Hazier Clear day Hazy day
How Far Can You See? Dagger Mountain 17 Miles Good Day – over 100 miles It’sthis good or better 10% of the time. Average Day – (65 –75) miles Most visitors will see this. Worst Days – 35 miles It’s this bad or worse 10% of the time.
Visibility Concepts
What is Visibility? Visibility is historically defined as: “the farthest distance one can see a large black object against the background sky.”
What is Visibility? Molecules in the earth’s atmosphere scatter light, limiting the maximum distance you can see even under under natural conditions. The scattering of light by air molecules is called “blue sky” or “Rayleigh” scattering. The theoretical limit of visual range is 243 miles. Visual Range
What is Visibility? Visibility is more than just how far we can see. It is better described as how “well” we can see and appreciate the colors, textures, forms, and detail in distant landscape features. Visual Range
Three Types of Haze How impairment manifests itself depends upon the extentand distribution of particles and gases in the atmosphere. Visibility Impairment:generally associated with discoloration, haziness, and loss of color and detail. Plume:Pollutants are constrained in a tight elevated layer that can often be traced to a nearby source. Layered Haze:Pollutants are often trapped near the ground beneath a temperature inversion. The top edge of the pollutant layer is visible. Uniform Haze:Pollutants are uniformly distributed from the ground to a height well above thehighest terrain feature.
How Pollutants Cause Haze Particles and gases in the atmosphere can scatter or redirect image-forming light as it travels to the eye. Through scattering, some image-forming light is removed from the view path.In addition, extra light, sunlight, and light reflected from the clouds and ground are added to the sight path, which interferes with the ability to view the scene. Scattering Scattering in the Atmosphere
How Pollutants Cause Haze Another cause of visibility impairment is absorption. Particles and gases in the atmosphere absorb or remove image-forming light before it ever reaches the viewer’s eye.Although significant, absorption usually is less important than scattering processes when we talk about visibility impairment. Absorption Absorption in the Atmosphere
How Pollutants Cause Haze Extinction is a visibility metric used to describe the combined effect of scattering and absorption. It is proportional to the total amount of light removed as light passes through the atmosphere and is related to the concentration of pollutants. Extinction
Parameters Describing Visual Air Quality Deciview is an index of haziness that expresses changes in scene quality. It is directly related to perceived changes in visibility. As haziness increases, so does the deciview value. A one deciview change represents a 10 percent change in extinction. Most people can perceive a one deciview change. 1. Visual Range 2. Extinction 3. Deciview
Microscopic Airborne Particles Examples of particles that affect visibility Particles fall into two size categories: 1. Coarse Particles greater than 2 micrometers and less than 10 micrometers (These particles usually deposit out of the air close to their source.) 2. Fine Particles 2.5 micrometers and smaller (These particles can stay suspended for weeks and are transported far from their source.)
Fine particles scatter light more efficiently, and there are a lot more of them. They are most important when assessing visibility impacts. Particle Size Matters Base Case – Clear atmosphere Increasing the mass of coarse particles (dust) by a certain amount has little effect on visibility in this scene. Increasing the mass of fine particles (sulfur) by the same amount has a much bigger effect on visibility in the same scene.
Five Particle Types that Reduce Visibility Although particulate matter is made up of many chemical species, there are five key contributors to visibility impairment. Primary Pollutantsare emitted directly into the atmosphere, and include: 1. Sulfur Dioxide 2. Nitrogen Oxides 3. Elemental Carbon 4. Organic Compounds 5. Soil or Dust Secondary Pollutantsform from chemical reactions involving primary gas emissions (precursors), and include: 1. Ammonium Sulfate 2. Ammonium Nitrate 3. Organic compounds
Secondary Particle Formation Precursor emissions disperse in the atmosphere, convert into secondary particles through complex atmospheric chemical reactions, then travel long distances to deposit in remote areas far from their source.
Sulfate Formation and Growth Nitrate particles are created in much the same way from nitrogen oxide gases. Organic particles similarly evolve from gaseous emissions of hydrocarbon gases. Ammonium Sulfate forms from sulfur dioxide gas emissions. Oxidation of SO2 to sulfate can be slow, requiring 1 to 2 days to convert about half of the SO2. In the presence of mist, fog, or clouds, transformation can occur in a few hours or in several minutes.
Relative Humidity Affects Visibility Fine sulfate and nitrate particles are hygroscopic. They readily attract and absorb water molecules. Under high relative humidity conditions, they quickly grow to a size that is very efficient at scattering light. The fine sulfur levels in all views is the same (20 g/m3). The relative humidity changes from 10% to 50% to 90%. Dagger Mtn. 10% RH visual range = 35 mi. Dagger Mtn. 50% RH visual range = 27 mi. Dagger Mtn. 90% RH visual range = 10 mi.
Policies Aimed at Improving Visibility
National Park Service Organic ActAugust 26, 1916 “… to conserve the scenery and the natural and historic objects and the wildlife therein and to provide for the enjoyment of the same in such manner and by such means as will leave them unimpaired for the enjoyment of future generations.”
Big Bend National ParkAuthorized by Congressional Act June 20, 1935 “…lands…as necessary for recreational park purposes...are hereby established, dedicated, and set apart as a public park for the benefit and enjoyment of the people.”
Clean Air Act 1970 Act Established special goals for visibilityin national parks, wilderness areas, and international parks. 1977 Amendments Set a goal to achieve natural visibility conditions: the prevention of any future, and the remedying of any existing, visibility impairment in mandatory Class I federal areas in which impairment results from man-made air pollution. The Amendments required the EPA to issue regulations to assure “reasonable progress” toward meeting the national goal of no human-caused emissions. 1990 Amendments Expanded the focus to include mitigating regional haze, an issue encompassing multiple sources located within multiple jurisdictions and under the purview of multiple institutions.
Regional Haze RuleApril 1999 Addresses visibility impairment in the form of “regional haze” The rule calls for states to work together to improve visibility in all mandatory Class I national parks and wilderness areas. States are encouraged to work together in regional partnerships to develop and implement multi-state strategies to reduce emissions of visibility-impairing fine particle pollution. Additionally, states must determine whether or how much emissions from sources in a given area affect visibility in a downwind Class I area.
What is the Park Doing?
IMPROVE Interagency Monitoring of Protected Visual Environments Big Bend has been part of the IMPROVE national monitoring program since 1981. The park’s goal is to develop a sound visibility database in order to establish current visibility levels, examine trends, and compare visibility at Big Bend to other remote areas of the United States.
Visibility Monitoring - Optical Transmissometers and nephelometers are used to record the optical characteristics of the atmosphere – measuring the amount of light transmitted over a specific viewing path. Transmissometers measure extinction. Nephelometers measure scattering.
Visibility Monitoring - Aerosol Aerosols are microscopic solid and liquid particles suspended in the air. Measurements of these particles help to identify which particles are reducing visibility. Particles are collected on filters in various size ranges. A profile of particle types, sizes, and concentrations can be obtained. IMPROVE fine particle monitor
Visibility Monitoring - View Big Bend operated a 35 mm camera from 1981–1985. Photographs were taken 3 times a day. 8 mm time-lapse movies recorded dynamic scene changes for several years. Photography documents the changing appearance of a scene as visibility levels vary, documenting changes in haze levels, lighting conditions, vegetative cover, & cloud effects. Big Bend now operates two web cameras that transmit data and live pictures of current visibility conditions to the web. The view of the Sierra Del Carmens updates every 15 minutes, while the view from the Chisos Basin updates every 30 minutes. View the website at: www2.nature.nps.gov/air/webcams/parks/bibecam/bibecam.htm
Other Air Quality Monitoring Ozone is measured in the atmosphere on a continuous basis. Rainfall chemistry analysis began in 1980 and is part of a nationwide system that monitors changes in chemistry and acid content of precipitation. A dry deposition monitor measures nitrates, sulfates, ammonium, sulfur dioxide, and nitric acid in the atmosphere. A UV spectrophotometer measures UVB radiation to assess the effects of environmental stressors on ecological systems.
National Visibility Trends, 1990–1999 Over a 10-year period most parks show some improvement in average haze levels on the clearest days. Big Bend is one of three parks that shows continued degradation on these days. 20% Clearest Days -- Best Visibility Conditions 20% Haziest Days -- Worst Visibility Conditions Most parks show some degradation (or worsening) of visual conditions on hazy days over the same period. Note that visibility degradation in the southwest is particularly significant and that Big Bend is one of three parks where haze is getting worse.
Annual Aerosol Extinction, 1996–1998 Inner Mountain West Big Bend has some of the worst haze in the western United States. Compare: Big Bend (28 Mm-1) To: Inner Mountain West (15 Mm-1) Big Bend Extinction is proportional to image-forming light lost over a unit of distance. Higher light extinction levels correspond to hazier conditions.
Fine Mass Particulate matter observed during BRAVO and supported by long-term IMPROVE monitoring indicates that visibility is dominated by fine particles, but at times there are significant contributions from coarse dust particles. Big Bend Fine particles sampled at Big Bend consist mainly of ammoniated sulfate and organic carbon with black carbon, soil dust, and nitrate particles as minor factors.
Sulfate Mass Sulfate Fraction of Fine Mass On an annual average, sulfates account for between 40 and 50% of the fine mass at Big Bend. Sulfate compounds result from direct emissions of sulfur dioxide and generally contribute more to haze than any other individual pollutant. The oxidation of SO2 to sulfate depends on the oxidative capacity of the atmosphere which is influenced by NOx and volatile organic carbon emissions.
Organic Mass Organic Fraction of Fine Mass On an annual average organics constitute 20–30% of the fine particles creating Big Bend haze. Carbonaceous particles, organic compounds, and light-absorbing carbon (LAC) generally constitute the second largest individual component contributing to haze at Big Bend.