Download
1 / 19
190 likes | 308 Views
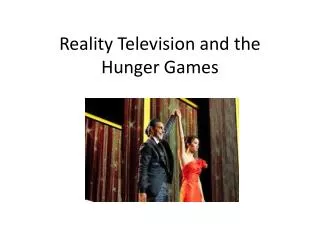
Reality of Hunger in the Houston Area. Reynalda Garza and granddaughters Martha’s Kitchen. Child Hunger Indicators. Extreme thinness Puffy/swollen skin Dry, cracked lips Chronic sickness Saving or hoarding food Inability to concentrate. Hunger Every Day. Each day, 35,000 suffer from

E N D
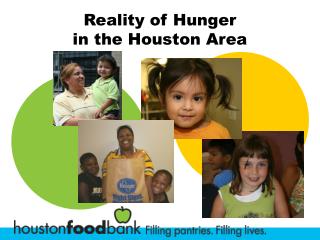
Reynalda Garza and granddaughters Martha’s Kitchen
Child Hunger Indicators • Extreme thinness • Puffy/swollen skin • Dry, cracked lips • Chronic sickness • Saving or hoarding food • Inability to concentrate
Hunger Every Day • Each day,35,000 • suffer from • hunger
HFB Clients • Children under 1844%
HFB Clients • Households with at leastone working adult • 47%
HFB Clients • Households with at least one member in poor health30%
HFB Clients • Homeless • 15%
Poverty • 891,432 Food Insecurity 932,253
The Poverty Gap • $8,000
Poverty is Growing In 6 years, Houston MSA grew from 3.7M to more than 5M; 16% are poor In Houston, 22.9% poverty rate Texas has third-highest food insecurity rate at 16%; fourth-highest hunger rate 11
Lbs per poor personAnnualized 3 106 47 43 29 52 48 20 40 120 HFB42National60 35 28 13 39 37 48 72 71
Child care Transportation Employment Medicine Rent Utilities Job training Education It’s More than Food
Tough Choices Food vs. Rent43%
Tough Choices Food vs. Utilities47%
Tough Choices Food vs. Medicine37%
Family Budget • Average family • 4% Low income family 10%
Family Budget • Average family • 11% Low income family 32%