Download

1 / 33
330 likes | 639 Views
Using Flowcharting to Improve Inefficiencies. Marsha Moxley, RN, BSN, MA, CPHQ February 10, 2010 10:15-11:45 AM. Learning Objectives. By the end of this session, participants will be able to: Identify the three most common shapes used to develop a flowchart.

E N D
Using Flowcharting to Improve Inefficiencies Marsha Moxley, RN, BSN, MA, CPHQ February 10, 2010 10:15-11:45 AM
Learning Objectives By the end of this session, participants will be able to: • Identify the three most common shapes used to develop a flowchart. • List three different types of flowcharts. • Describe the reason for utilizing flowcharting to understand the basic concept of process management.
When Should you Use Flowcharting? • To gain knowledge & understanding of how the actual system works versus ideal system • To identify redundant steps in a system to improve performance • To reduce variation and eliminate waste to improve the quality & cost of care delivery
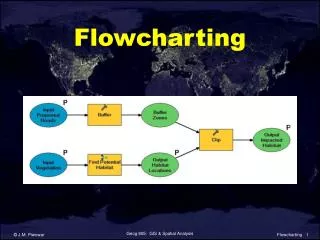
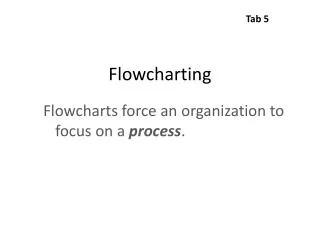
Purpose of Flowchart A flowchart is a picture of the steps (processes) within a system. Flowcharts are utilized to examine the relation and sequence of steps: to identify redundancy, unnecessary complexity, inefficiencies and to create a common understanding of the flow of a system
"Flow Chart" is a Snap Shot of your Business Processes. • You can tell a lot about the complexity (and often over-complexity) of many business processes just by looking at an as-is flow chart of them - without even reading the text in the symbols. • You can easily see the flow of information and materials, branches in the process, opportunities for infinite loops, the number of process steps, inter-departmental operations, and more.
What is the Difference between a Process and a System? • Process: a series of actions that lead toward a particular result • System: regularly interacting or interdependent group of items forming a unified whole. Methodical in procedural of plan Definitions from Webster’s New Collegiate Dictionary
Usefulness of Flowcharts In process improvement, flowcharts are often used to clarify how a process/system is being performed or to agree how it should be performed. Assists in standardization of systems as a graphical format for procedures and to assist in training of procedures.
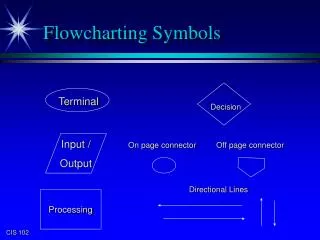
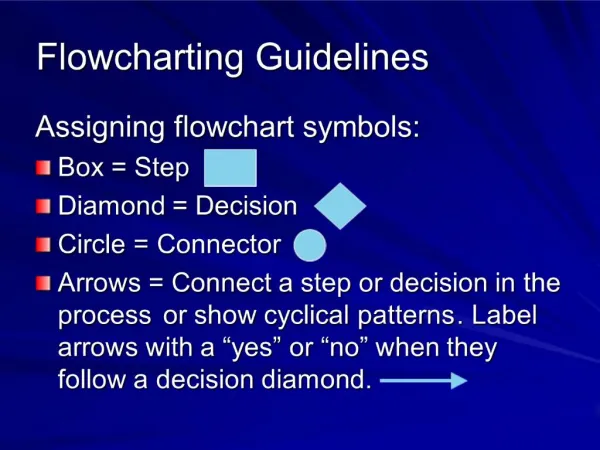
Oval: Represents Start or Stop of process/system. The ovals are the boundaries. Rectangle: Activity Step (s) of a process. Diamond: Decision Points in process flow. Form a question. Each decision should have a “yes” or “no path. Flowcharting Symbols
Small Circle: Represents connections in process flow. More than one column or more than one page. 2 Triangle: A step where there is waiting or storage occurs. Example: Admission/discharge waits Arrow: A step where product (or a patient) is being transported. Example: To Therapy or Dialysis Flowcharting Symbols
If you don’t involve the user, you will develop the wrong system. Brian Joiner
Steps to Develop a Flowchart • Decide on the system to flowchart. • Define the beginning and ending steps of the system. (These are known as the boundaries)
Steps to Develop a Flowchart… continued 3. Describe the beginning of the system with an oval. (When developing a flowchart, steps can be written on Post-it notes so that the actions can be reordered easily) • Ask “What Happens Next”?, each subsequent process step will be in a rectangle shape.
Steps to Develop a Flowchart…Continued 5. When a decision step occurs, use a diamond shape for the questions. Write yes / no and develop a path for each. ( Make sure each decision loop reenters the system or is pursued to a conclusion) 6. Describe the ending step in an oval. Sometimes, due to the branching at decision points, a system may have more than one ending boundary, especially when it is a complex “super’ system.
Things are the way they are simply because that got that way…. It’s always been done that way….
Common Names for Flowcharts: • Process Flow Chart • Process Map • Process Chart • Business Process Model • Process Model • Process Flow Diagram • Work Flow Diagram • Business Flow Diagram
Top Down Flowchart Step 1: Plan To Write AHCA Application Step 2: Organize /assign Roles & set deadlines Step 3: Submit the darn 3.1 Get Final clean copy from writer 3.2 Credit card approval 3.3 Submit on-line 3.4 Go out and celebrate! 1.1 Assess if eligible to apply 1.2 Review AHCA Application 1.3 Attend Workshop 1.4 ETC…… 2.1 Copy of application to team 2.2 Assign sections for content experts 2.3 Set deadlines for completion 2.4 Review data, decide improvements 2.5 Assign graphs – review options 2.6 Assign 1 writer 2.7 Assign reviewer for English, sentence structure and grammar 2.8 ETC…….
Alarm Goes Off Yes A Can I hit the snooze button? Go back to Sleep Blow Dry Hair No Get OOB & turn off alarm Decide what to wear Let the Dog Out Yes Any special meeting? Take A Shower No Start Coffee Get dressed & put on jewelry Turn on TV & listen to News Apply makeup A 1
Change would be easy if it weren’t for all the people
Risk Identification/Prevention New Admission/Re-admission Complete 24hr Admission Assessment 1. Skin assessment to be 1st section completed 2. Compare assessment findings to risk factors on IPOC. YES NO Is pressure ulcer present? Assess change in risk status by weekly skin assessments, change of condition, etc. *See below change of condition criteria YES NO Pressure Ulcer Flow Diagram 1. Discuss risks with resident and family/Risk brochures 2. Implement immediate interventions. 3. Develop individualized care plan. Pressure ulcer identified from admission skin assessment/weekly skin assessment/observation. • Implement resident specific interventions immediately: • Specialty mattress/pressure reduction mattress on bed • Pressure reduction cushion in wheelchair • Treatment as ordered • Individualized repositioning • *See Pressure Ulcer Guideline and IPOC Plan of Care/Communication Treatment: Actions/Steps Initiate IPOC – BE565 and place individual resident interventions and mark problems/risk factors Notify physician and document notification Input MD order/treatment into Vista Keane system Notify family and document notification Print new treatment order and place on Treatment Administration Record (TAR) • Notify: • Dietary • Activities • Social Services • Initiate BE598C – Pressure Ulcer Report and document initial assessment of pressure area including: • Location and staging • Size (length x width/depth) presence and location of • undermining and tunneling • Edudate/if present” type, color, odor, and approximate amounts • Pain/if present: nature and frequency • Wound bed: color & type of tissue/character including/character • including evidence of healing (granulation) or necrosis (slough • and eschar). • Description of would edges and surrounding tissue • *Change of Condition criteria: May include the following: • Bed Mobility Problem • Bedfast • Bowel incontinence • Previous Ulcer • Skin desensitized to pain or pressure • Daily Restraint Reassess, re-evalute and revise interventions when progress is not note within 14 days.
National Patient Safety Foundation’s (NPSF) Philosophy Most errors are a result from faulty Systems rather than human error, e.g., poorly designed processes that put people in situations where errors are more likely to Be made. Those people are in essence “set up” to make errors for which they are not truly responsible”.
Developing Flowchart Tips • Use post-its & sharpies /markers (Visible) • Doesn’t have to be in a meeting room - go to Nursing Station and put each process on a post-it note • Use flipchart paper / ability to switch steps easily • Ask those that work in the system to validate the flowchart is accurate versus ideal
Common Questions to ask the User of the System? • “What do you do first?” • “What happens next?” • “Is it always that way?” “Does it ALWAYS work this way?” • “Do you sometimes do something else?” • “Is there ever any problems you experience because of lack of training or supplies or equipment?”
Case Study / Group Exercise • Instructions: • Flowchart a Falls System • 2. Decide Who Will Debrief To All • 3. Have Some Fun!
Flowcharting Software • Word /PowerPoint/Excel draw function • www.Smart.draw.com • www.breezetree.com • www.edrawsoft.com • www.springcape.com “Google” Flowcharting and you will be amazed!
References • www.Smart.draw.com • www.breezetree.com • Webster’s New Collegiate Dictionary • The Team Handbook, Joiner, 5th Ed., 2001 • Root Cause Analysis: Simplified Tools and Techniques, Bjorn Anderson, Tom Iagerhaug, Milwaukee, WS, ASQ Quality Press, 2000.
Questions?Thank you! Marsha Moxley Cell: 407-247-8814