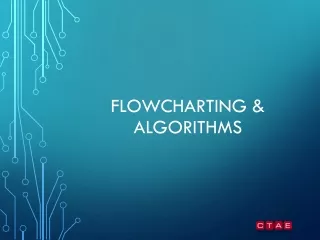
Guide to Creating Flowcharts for Program Development
Learn the fundamentals of flowcharting for programming - from defining the problem to implementing and improving your program. Discover how to plan, code, test, and document programs effectively. Understand the symbols, processes, and steps involved in flowcharting. Follow a step-by-step example of a pay-calculating program with detailed explanations.

Guide to Creating Flowcharts for Program Development
E N D
Presentation Transcript
Writing a program • Defining the problem • Write down what the program will do • Planning • Write down the steps, draw a flowchart • Programming • Coding, including errors correction, testing • Documenting • Adding comments • Implementing • Improvement, making the program better
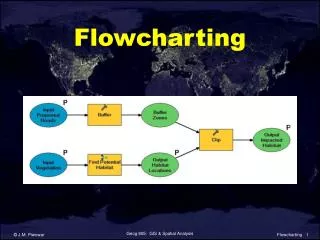
Objective • A program can be divided into 3 parts: • Input data • Processing data – Calculation, etc. • Output information/results Processing Input Output
From Top to Bottom & from Left to Right Make turn Join together Arrows
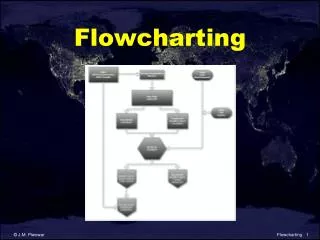
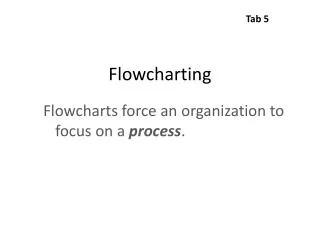
START END Display message “How many hours did you work?” Display message “How much do you get paid per hour?” Read Hours Read PayRate Multiply Hours by PayRate. Store result in GrossPay. Display GrossPay What is a Flowchart? • A flowchart is a diagram that depicts the “flow” of a program. • A diagram made up of symbols of various shapes connected by arrows. • Those symbols indicate either actions to be taken or decisions to be made. • It helps us planning & programming. • The figure shown here is a flowchart for a pay-calculating program.
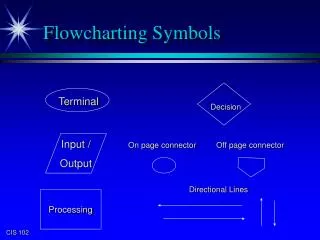
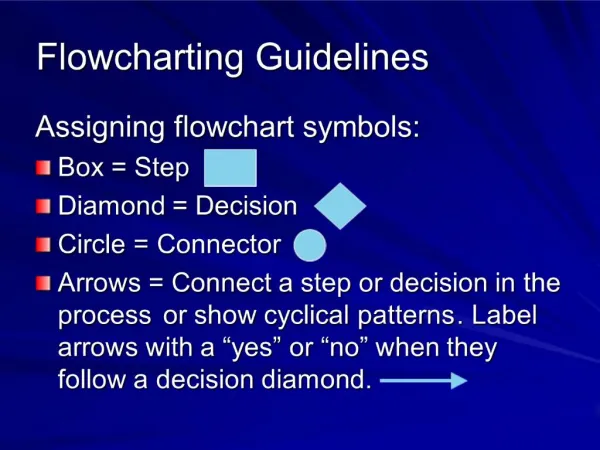
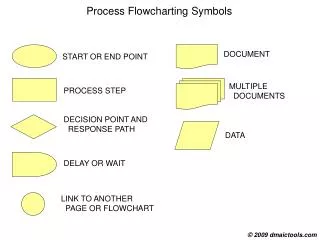
START END Display message “How many hours did you work?” Display message “How much do you get paid per hour?” Read Hours Read PayRate Display GrossPay Rounded Rectangle Basic Flowchart Symbols • Notice there are three types of symbols in this flowchart: • rounded rectangles • parallelograms • a rectangle • Each symbol represents a different type of operation. Parallelogram Multiply Hours by PayRate. Store result in GrossPay. Rectangle Rounded Rectangle
START END Display message “How many hours did you work?” Display message “How much do you get paid per hour?” Read Hours Read PayRate START END Display GrossPay Terminal Basic Flowchart Symbols • Terminals • represented by rounded rectangles • indicate a starting or ending point Multiply Hours by PayRate. Store result in GrossPay. Terminal
START END Display message “How many hours did you work?” Display message “How much do you get paid per hour?” Read Hours Read PayRate Display message “How many hours did you work?” Read Hours Display GrossPay Basic Flowchart Symbols • Input/Output Operations • represented by parallelograms • indicate an input or output operation Input/Output Operation Multiply Hours by PayRate. Store result in GrossPay.
START END Display message “How many hours did you work?” Display message “How much do you get paid per hour?” Read Hours Read PayRate Display GrossPay Basic Flowchart Symbols • Processes • represented by rectangles • indicates a process such as a mathematical computation or variable assignment Multiply Hours by PayRate. Store result in GrossPay. Process Multiply Hours by PayRate. Store result in GrossPay.
START END Display message “How many hours did you work?” Display message “How much do you get paid per hour?” Read Hours Read PayRate Display GrossPay Stepping Through the Flowchart Stepping Through the Flowchart In the next seven slides we will step through each symbol in the flowchart. We will show the program output and the contents of the variables. Multiply Hours by PayRate. Store result in GrossPay. Variable Contents: Hours: ? PayRate: ? GrossPay: ?
START END Display message “How many hours did you work?” Display message “How much do you get paid per hour?” Read Hours Read PayRate Display GrossPay Stepping Through the Flowchart Step 1: An Output Operation Stepping Through the Flowchart Screen Output How many hours did you work? Multiply Hours by PayRate. Store result in GrossPay. Variable Contents: Hours: ? PayRate: ? GrossPay: ?
START END Display message “How many hours did you work?” Display message “How much do you get paid per hour?” Read Hours Read PayRate Display GrossPay Stepping Through the Flowchart Stepping Through the Flowchart Step 2: An Input Operation (User types 40) How many hours did you work? 40 Multiply Hours by PayRate. Store result in GrossPay. Variable Contents: Hours: 40 PayRate: ? GrossPay: ? The value 40 is stored in Hours.
START END Display message “How many hours did you work?” Display message “How much do you get paid per hour?” Read Hours Read PayRate Display GrossPay Stepping Through the Flowchart Stepping Through the Flowchart Screen Output How much do you get paid per hour? Step 3: An Output Operation Multiply Hours by PayRate. Store result in GrossPay. Variable Contents: Hours: 40 PayRate: ? GrossPay: ?
START END Display message “How many hours did you work?” Display message “How much do you get paid per hour?” Read Hours Read PayRate Display GrossPay Stepping Through the Flowchart Stepping Through the Flowchart How much do you get paid per hour? 20 Step 4: Input Operation (User types 20) Multiply Hours by PayRate. Store result in GrossPay. Variable Contents: Hours: 40 PayRate: 20 GrossPay: ? The value 20 is stored in PayRate.
START END Display message “How many hours did you work?” Display message “How much do you get paid per hour?” Read Hours Read PayRate Display GrossPay Stepping Through the Flowchart How much do you get paid per hour? 20 Step 5: The product of Hours times PayRate is stored in GrossPay Multiply Hours by PayRate. Store result in GrossPay. Variable Contents: Hours: 40 PayRate: 20 GrossPay: 800 The value 800 is stored in GrossPay.
START END Display message “How many hours did you work?” Display message “How much do you get paid per hour?” Read Hours Read PayRate Display GrossPay Stepping Through the Flowchart Screen Output Your gross pay is 800 Multiply Hours by PayRate. Store result in GrossPay. Variable Contents: Hours: 40 PayRate: 20 GrossPay: 800 Step 6: An Output Operation
Four Flowchart Structures • Sequence (TODAY) • Decision • Repetition • Case
Sequence Structure • A series of actions are performed in sequence • The pay-calculating example was a sequence flowchart.
A Connectors • Sometimes a flowchart will not fit on one page. • A connector (represented by a small circle) allows you to connect two flowchart segments.
START END A A Connectors • The “A” connector indicates that the second flowchart segment begins where the first segment ends.
Review • What do each of the following symbols represent? (Answer on next slide)
Answer • What do each of the following symbols represent? Terminal Input/Output Operation Process
Review • Name the four flowchart structures. (Answer on next slide)
Answer • Sequence • Decision • Repetition • Case
Flowcharting Problems Write out the steps to solve the problem, then draw the diagram • Flowchart a program to input the radius of a circle, and then calculate and print the area. The formula is Area = Pi * Radius2 • Flowchart a program that will input four marks and calculate the average. • Flowchart a program that will take a temperature in Fahrenheit (F) convert it to Centigrade (C) The formulas are below. • C = ( F - 32) / 1.8 • Output the results with a message that states: “ ___ degrees C is equal to ___ degrees F”