Download
1 / 22
220 likes | 358 Views
A Project meeting for the APEC HRD 04 11A "Emergency Preparedness Education: Learning from Experience, Science of Disasters, and Preparing for the Future" Tsukuba International Congress Center, Ibaraki, Japan.

E N D
A Project meeting for the APEC HRD 04 11A "Emergency Preparedness Education: Learning from Experience, Science of Disasters, and Preparing for the Future" Tsukuba International Congress Center, Ibaraki, Japan • Damage of infrastructures due to the 2011 off the Pacific Coast of Tohoku earthquake and tsunami • Case study for water outages and sewerage disruption • in the Kanto regions - G. Shoji Faculty of Engineering, Information and Systems University of Tsukuba gshoji@kz.tsukuba.ac.jp
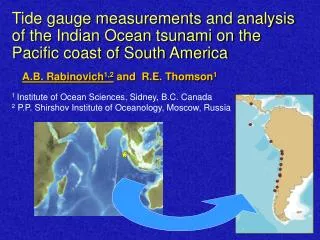
Extreme damage of infrastructures due to the 2011 off the Pacific Coast ofTohoku EQ and tsunami Damage of substations of electric power supply systems Damage of buried pipelines of water supply systems Inundation areas Inundation height (m) Seismic intensity distribution Power failures of 4,858,580 houses in the areas offered by Tohoku Electric Power Company as of March 17, 2011 Damage of buried pipelines of sewerage systems Damage of gasholders of gas supply systems 0 20 40 Reference data on inundation areas: Geospatial Information Authority of Japan (GSI) Disruption of totally 460,000 houses as of March 12, 2011 Reference data on inundation heights: The 2011 Tohoku Earthquake Tsunami Joint Survey GroupSep. 7th, 2011 Version
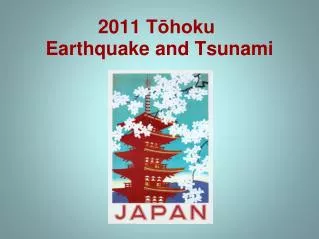
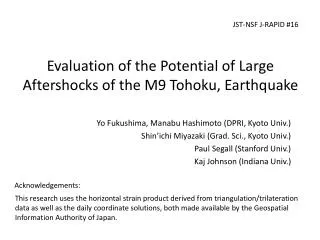
Now, focus on damage of water treatments in the 2011 off the Pacific Coast ofTohoku EQ and tsunami Date: 14:46:18, March 11, 2011 (JST) Magnitude: Mw=9.0 Epicenter: 38.322°N, 142.369°E Depth: 32km Total damage of water supply systems Water outages:2,105,091 houses Epicenter Total damage of sewerage systems Sewerage pipelines:642km Manholes:20,659 Treatment facilities:120 Pump stations:112 Damaged areas Google earth, http://maps.google.com/maps
Water outages in the 2011 off the Pacific Coast ofTohoku EQ and tsunami Ibaraki :444,288 /1,088,848 Tochigi :56,061 /745,045 Gunma :54 /755,297 Saitama :150 /2,842,662 Chiba :373,069 /2,515,220 Niigata :2,852 /8,389,22 Nagano :804 /794,362 Gifu :30 /736,555 Number of water outages/ Number of households • Total :2,105,091 • Aomori :1,824 • /513,311 • Iwate :179,308 • /483,971 • Miyagi:616,480 • /901,254 • Fukushima:394,142 • /720,587 • Akita :28,190 • /390,335 • Yamagata:7,839 • /388,670 Map by authors. Data sources of map: MHLW, Damage situation and measures for the Great East Japan Earthquake (11th – 34th Announcement), http://www.mhlw.go.jp/stf/houdou/2r98520000014j15.html
Sewerage damage in the 2011 off the Pacific Coast ofTohoku EQ and tsunami Damaged pipeline lengths [km]/ Buried pipeline lengths [km] *1 Number of damaged manholes *2 Total :20,659 Aomori :0 Iwate :170 Miyagi :11,194 Fukushima:3,397 Ibaraki :4,656 Tochigi :25 Saitama :6 Chiba :981 Kanagawa:13 Tokyo :212 Niigata :5 Total :642 Aomori :0.1 /113 Iwate :13 /3,712 Miyagi:312 /9,702 Fukushima:120 /5,110 Ibaraki :129 /9,509 Tochigi :2 /287 Saitama :0.006 /214 Chiba:54 /8,510 Kanagawa:0.5 /11,625 Tokyo :12 /15,793 Niigata :1 /426 Map by authors. Data sources of map: *1 MLIT, The Great East Japan Earthquake (105th Report), http://www.mlit.go.jp/saigai/saigai_110311.html, *2 Investigation Committee on Countermeasures to Sewerage Damage due to Earthquake and Tsunami, 5th Committee document, http://www.mlit.go.jp/mizukokudo/sewerage/mizukokudo_sewerage_tk_000186.html
For anticipated future seismic hazards Seismic strengthening for pipelines and its prioritization Planning of effective restoration strategy 0.14 Sewerage networks and seismic hazards e.g. Tokyo city area Seismic fragility curve: Model for predicting damage 0.12 0.10 0.08 Damage ratio 0.06 Real data in the Kobe earthquake 0.04 0.02 0 4.5 5.0 5.5 6.0 6.5 7.0 Sewerage damage in the 1995 Kobe earthquake Seismic intensity IJ It is much significant to model damage data for accurate seismic risk assessment
Analytical frameworks Collect the damage data of water supply systems (WSS) and sewerage systems (SS) suffered by ground excitations at Ibaraki and Chiba prefectures by carrying out interviews for related local government sectors. Quantify two damage ratios RN on physical damage points and RL on disrupted pipeline lengths, for 14 municipalities in Ibaraki prefecture and 8 municipalities in Chiba prefecture. Compare the damage ratios in subject municipalities with estimated ones derived by our previously proposed seismic fragility curves.
Target areas for analysis Japan Target areas: Ibaraki Prefecture Chiba Prefecture 2011.3.11 Epicenter 1995.1.17 Kobe EQ
Estimation of seismic intensity distribution Instrumental seismic intensity IJ Sources Mw and location of hypocenter: Japan Meteorological Agency (2011) Attenuation relationship: Si & Midorikawa (1999) Amplification factor on Seismic intensity IJ: Suetomi et al. (2005) Interpolate the spatial distribution on IJ by Simple Kriging method based on the strong ground motions data by Japan Meteorological Agency (2011) and National Research Institute for Earth Science and Disaster Prevention (2011)
Subject municipalities • and derived seismic intensity distribution Seismic intensity IJ Hitachi Kasama -3.4 Mito 3.4-4.4 Hitachinaka 4.5-4.9 Shimotsuma Oarai 5.0-5.4 Omitama 5.5-5.9 Hokota 6.0-6.4 Tsukuba Kashima 6.5- Toride Itako Kamisu Ichikawa Katori Inashiki Funabashi Abiko Urayasu Sakura Narashino Chiba
Analyzed data for WSS and SS • Set damage data on distribution pipes and sanitary pipes • for unifying physical constraints of exposed engineered systems • - Total pipeline lengths L • - Disrupted pipeline lengths Ld • - Number of physical damage points Np • Damage modes • Consequences measures for WSS damage • Restoration periods • Consequences measures for SS damage • Periods of restriction for use for sewerage systems • Temporary restoration periods • Median of estimated seismic intensities IJmfor third meshes overlapped to the areas of subject municipalities
Definition of damage ratios RN: Ratio of number of physical damage points Np divided by total lengths L Dimension [point / km] RL: Ratio of disrupted lengths Ld divided by total lengths L Dimension [km / km]
Relation of RNandIJmfor water supply systems 1.2 Urayasu 1.0 0.8 RN[/km] Kashima 0.6 0.4 Inashiki Kamisu 0.2 0 4.5 5.0 5.5 6.0 IJm Urayasu and Kashima data: Extremely largeRN of 0.654/km to 1.081/km with IJmof 5.1 to 5.8 Inashiki and Kamisu data: LargerRN of 0.247/km to 0.316/km with IJmof 5.3 to 5.5
Relation of RNandIJmfor water supply systems 1.2 1.0 South Ibaraki Waterworks Agency (Ushiku, Ryugasaki, Toride) 0.8 RN[/km] Tsukuba 0.6 Kasama Narashino Oarai Shimotsuma Sakura Hitachi 0.4 Mito Chiba Funabashi Hitachinaka 0.2 Hokota Ichikawa Omitama 0 4.5 5.0 5.5 6.0 IJm Hitachi, Hitachinaka, Mito, Oarai, Hokota and Narashino data: MiddleRN of 0.0571/km to 0.136/km with IJmof 5.2 to 5.8
Relation of RLandIJmfor sewerage systems 0.6 Hinode, Itako 0.5 RL[km/km] 0.4 0.3 0.2 Urayasu Kashima 0.1 0 4.5 5.0 5.5 6.0 IJm Hinode areas in Itako data: Remarkably huge RL of 0.538 with IJmof 5.9 Kashima and Urayasu data: Extremely large RL of 0.0907 to 0.112 with IJmof 5.1 to 5.8
Relation of RLandIJmfor sewerage systems 0.6 0.5 RL[km/km] 0.4 0.3 Kasama Kamisu Inashiki 0.2 Katori Hitachinaka Chuo, Chiba 0.1 Hokota 0 4.5 5.0 5.5 6.0 IJm Kasama areas in Kasama, Kamisu and Katori data : LargerRL of 0.0649 to 0.0818 with IJmof 5.2 to 5.4 Hitachinaka, Hokota, Inashiki data and Chuo areas in Chiba : Middle RL of 0.0228 to 0.0412 with IJmof 5.0 to 5.8
Relation of restoration periods for water supply systems and IJm [day] [day] 60 60 Kamisu Kamisu 50 50 Restoration periods Restoration periods 40 40 Katori Kashima Kashima 30 30 Urayasu Urayasu Inashiki Inashiki 20 20 10 10 0 0 4.5 5.0 5.5 6.0 1.2 1.0 0.2 0.6 0.4 0 0.8 IJm RN[/km] Kamisu: Longest 57 days due to larger RN Kashima and Urayasu: 26 days to 34 days due to largest RN Inashiki: 23 days due to larger RN Katori: 37days due to largest RL
Relation of periods of restriction for use for sewerage systems and IJm [day] [day] 120 120 Periods of restriction for use Narashino Periods of restriction for use 100 100 Kamisu Kamisu 80 80 60 60 Itako, Hinode Itako 40 40 Urayasu Urayasu Inashiki Inashiki 20 20 0 0 4.5 5.0 5.5 6.0 0.6 0.5 0.1 0.3 0.2 0 0.4 IJm RL[km/km] Narashino: Longest 112 days due to next largest RN Kamisu: Second longest 83 days due to larger RL Itako, Inashiki and Urayasu: Longer 34 days to 44 days due to largest, larger and middle RL
Comparison of SS damage ratio RLin the Tohoku earthquake with those in the Kobe earthquake 0.6 Previously proposed seismic fragility curve (SFC) : Model for predicting damage Hinode, Itako 0.5 RL[km/km] 0.4 0.3 0.2 Mito 0.1 Kobe data 0 4.5 5.0 5.5 6.0 6.5 7.0 IJm RLat Mito and other 10 municipalities show good agreement with estimated values by SFC. RL at Hinode areas in Itako with IJm of 5.9 shows remarkably larger value than the value by SFC due to severe liquefaction.
Comparison of SS damage ratio RLin the Tohoku earthquake with those in the Kobe earthquake 0.6 Seismic fragility curve (SFC) : Model for predicting damage 0.5 Urayasu RL[km/km] 0.4 Chiba, Chuo 0.3 0.2 Katori 0.1 Abiko Kobe data 0 4.5 5.0 5.5 6.0 6.5 7.0 IJm RLat Katori, Abiko, Chuo treatment areas in Chiba and Urayasu with IJm of nearly 5.0 show larger values than those by SFC due to SS damage by severe liquefaction.
Comparison of SS damage ratio RLin the Tohoku earthquake with those in the Kobe earthquake 0.6 Seismic fragility curve (SFC) : Model for predicting damage 0.5 RL[km/km] 0.4 0.3 Hitachinaka Kasama 0.2 Kashima Inashiki Hokota 0.1 Kobe data Kamisu 0 4.5 5.0 5.5 6.0 6.5 7.0 IJm RLat Hitachinaka, Hokota, Kashima, Inashiki, Kasama treatment areas in Kasama and Kamisu with IJm of nearly 5.5 show larger values than those by SFC due to combination of strong ground excitations and liquefaction.
Conclusions Evaluate the dependency of physical damage and restoration of water supply systems (WSS) and sewerage systems (SS) on seismic intensities in the 2011 off the Pacific Coast of Tohoku earthquake focusing on the damage at Ibaraki and Chiba prefectures. Quantify two damage ratios RN on physical damage points and RL on disrupted pipeline lengths. • Compare the damage ratios in the Tohoku earthquake with estimated ones derived by previously proposed seismic fragility curves.