Download
1 / 35
370 likes | 761 Views
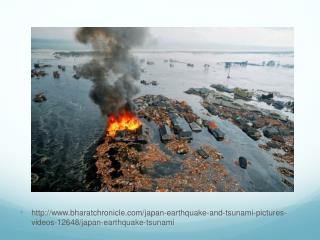
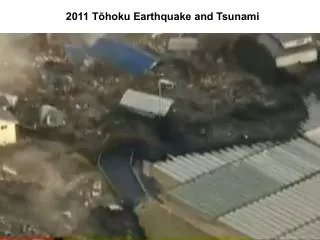
2011 Tōhoku Earthquake and Tsunami. MODIS satellite image on 26 FEB, before the tsunami. Scale bar is 10 km. MODIS satellite images on 13 MAR, after the tsunami. The red circle marks a fire. Scale bar is 10 km.

E N D
MODIS satellite image on 26 FEB, before the tsunami. Scale bar is 10 km.
MODIS satellite images on 13 MAR, after the tsunami. The red circle marks a fire. Scale bar is 10 km.
The Earth’s Crust consists of a number of continent size plates that move slowly. Most Earthquakes and Volcanoes occur along or near the boundaries of the plates. As the plates continue moving, rocks are locked together at the boundaries until stresses accumulate past the breaking point. Earthquakes occur when the rocks suddenly crack and slip along lines called faults (often at or near plate boundaries).
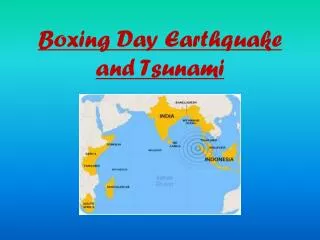
Velocities (mm/yr) and boundaries of the Plates Near Japan. When plates converge, the denser oceanic plate sinks or subducts below the less dense continental plate. The line, studded with triangles (same as for cold fronts) indicates the collision zone (usually an ocean trench). After the oceanic plate sinks enough, rock melts and rises to form a line of volcanoes about 100 km from the collision point.
Illustrated Sequences of Earthquakes and Tsunamis. In this sequence, the subducting plate forces the overriding continental plate to distort until stress becomes too great. At this point the overriding plate springs back. When any vertical motions occur in the ocean, the water is disturbed vertically and tsunami waves are produced. Animation at http://www.youtube.com/watch?v=4Xebwzb3dDE&feature=related
Out at sea, the tsunami wave is about 100 km long and usually less than 1 meter high. But as the wave approaches the shore, it slows down, its wavelength gets shorter, and the wave amplitude increases as the water alternately piles up much higher and is depressed much lower. Three factors affect the propagation and amplitude of the tsunami. 1. Slowing of the wave speed 2. Refraction and focusing 3. Lateral constriction into a narrowing bay (funnel effect, a form of focusing)
g = 10 ms-2 (acceleration of gravity) h = depth (m) “Shallow” Water Wave Speed “Shallow” Waves Typical Mid-Ocean Tsunami Speed Tsunamis are “Shallow” Waves since l 100 km >> Ocean Depth, h 4 km Why Tsunamis Become Deadly as They Approach Shore As tsunamis move into shallower water near shore, they slow down (c gets smaller) but their frequency, f, remains the same because just as many waves pass any point. As a result their wavelength also gets smaller because l=c/f. Waves conserve their energy as they move into shallow water, so when ldecreases, amplitude, a must increase to compensate. Also, if the waves are squeezed into a narrowing bay, width, w decreases, so amplitude, a, must increases to compensate. Water Wave Energy (per wavelength, l) Amplitude = a Width = w
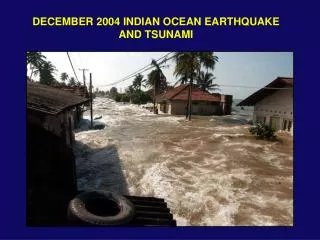
Storms can generate enormous waves, which can travel across the ocean to break on distant shores
Tsunami Amplitude over the Pacific Ocean. Ribbons of greater height are caused by focusing due to refraction. The tsunami caused one death in northern California when a man standing on a pier photographing the event was swept away and drowned.
Once a major earthquake occurs, the rest of the plate boundary adjusts. This causes aftershock earthquakes that are usually at least one order of magnitude smaller. The magnitude of the 2011 Tōhoku Earthquake (9.0) was 2.1 higher than the Haiti quake or over 1000 times more powerful. Earthquake and Aftershocks Circle Size indicates Magnitude Except for refraction, Sendai would have been safe from a tsunami
Wave Motion Wave Fronts Wave Refraction Waves always bend toward the region where they move more slowly. Speed Fast Slow Air = Fast Water = Slow Dispersion Refraction Waves always move at right angles to their crests or fronts. So, when one part of the wave front moves more slowly than another, the entire wave turns (refracts).
Refraction of Thunder Thunder cannot be heard far from the storm at ground level because sound waves travel refract upward as they move faster in the warm air near ground level than in the cold air aloft. COLD Wave Fronts HOT ZONE OF SILENCE
Funneling or Focusing Effect in Narrowing Bay SHALLOW = SLOW DEEPER = FASTER
Light contour lines (20 m intervals) show land elevation. This town was inundated because it was barely above sea level.
Weather has largely been favorable for radiation released into the air. The winds are mostly blowing out to sea (except for a few troubling hours at first).