Download
1 / 46
460 likes | 592 Views
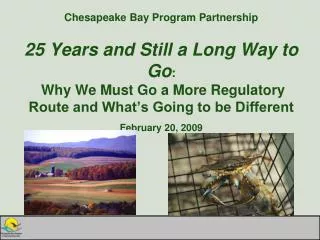
Chesapeake Bay Program Partnership 25 Years and Still a Long Way to Go : Why We Must Go a More Regulatory Route and What’s Going to be Different February 20, 2009. All The ‘State of the Bay’ Reports Have the Same Bottom-line. “…the Bay’s health remains degraded.”.

E N D
Chesapeake Bay Program Partnership25 Years and Still a Long Way to Go:Why We Must Go a More Regulatory Route and What’s Going to be DifferentFebruary 20, 2009
All The ‘State of the Bay’ Reports Have the Same Bottom-line “…the Bay’s health remains degraded.” Sources: UMCES 2008, CBP 2008, CBF 2007
In 2002, over 90% of the Bay and its tidal rivers were impaired due to low dissolved oxygen levels and poor water clarity, all related to nutrient and sediment pollution. Without oxygen and grasses, the Bay’s crabs, oysters, and fish cannot survive and thrive. Impaired Water Source: U.S. EPA 2002
2007 Bay Health Summary • Most of the Bay’s waters are degraded—less than one-third of Bay water quality goals are being met. • The Bay’s critical habitats and food webs are currently at about a third of desired levels. • Many of the Bay’s fish and shellfish populations are below historic levels. Source: CBP 2008
Extensive low to no dissolved oxygen conditions persist throughout the Chesapeake Bay and its Tidal Tributaries Source: www.chesapeakebay.net/data
Bay Restoration: About 50% of Actions Taken Source: CBP 2008
Cap Load Allocation At Current Rate of Implementation, We are Not Going to Achieve Our WQ Goals by 2010 Source: CBPO 2008
Nitrogen Loads to the Bay Still Above the 175 Million Lbs Basinwide Loading Cap Nitrogen Cap Load Monitoring-based estimates for major rivers and below fall-line wastewater treatment facilities plus model-based estimates for coastal plain portion of watershed.
Phosphorus Loads to the Bay Still Above the12.8 Million Lbs Basinwide Loading Cap Phosphorus Cap Load Monitoring-based estimates for major rivers and below fall-line wastewater treatment facilities plus model-based estimates for coastal plain portion of watershed.
Our Rivers are Running Cleaner…But Still Aren’t Clean Enough Source: CBP 2008
So, Why a Bay TMDL Now? • Impaired waters: over 90% of Bay and tidal rivers • EPA Policy requires development of a TMDL within 8-13 years of listing waterbody as impaired • Bay waters and tidal tributaries were listed as impaired on 303(d) lists in 1998 by MD, VA, DE, DC • Legal obligations: Lawsuit settlements (consent decrees) with VA and DC and MOU between MD and EPA resulted in 2010/2011 deadlines • Accelerate implementation: use latest science and increased accountability to expand implementation and speed up Bay restoration
TMDL 101: Required Elements • TMDL = WLA + LA + MOS • WLA = Waste Load Allocation to Point Sources and NPDES-regulated Stormwater Discharges • LA = Load Allocation to Nonpoint Sources • MOS = Margin of Safety against uncertainties • TMDLs must also: • Address critical conditions and seasonality • Include public review and participation • Be designed to achieve applicable Water Quality Standards
So What’s Different? • Scope • Allocation Scale • Accountability • Consequences • Adaptive • Implementation-focused
What’s the Scope of the Bay TMDL? • Entire watershed • Nutrients, sediments • All sources • Oxygen, clarity/Bay grasses, algae • All impaired tidal water segments
Impaired Segments • Clean Water Act requires a TMDL for each impaired waterbody • States, DC have listed Bay tidal waters on the basis of designated use by tidal Bay segments
Maryland will have 51 TMDLs –one for each impaired tidal segment • Each TMDL will address all sources within the watershed directly draining into the impaired tidal Bay segment
Who’s Developing the Bay TMDL? • EPA: given interstate waterbody, watershed • Six state watershed with four jurisdictions sharing tidal waters • Ex. NY loads influence MD and VA bay water quality conditions • Watershed jurisdictions are all at the table actively contributing, providing input at each step • Local governments and interested public have a key role in crafting next generation of implementation plans and helping ensure future reduction actions can meet states’ Bay water quality standards
Scale of allocations: 2003 Major River Basin Major River Basin by Jurisdiction Jurisdiction Tributary Strategy Basin Agreed to by the Chesapeake Bay Program Partners Partners’ Decision
Starting point from Bay watershed model… County Segment Impaired Segment Tributary Basin State County …leading to various aggregations of county segments.
Do we have the right scale of data? Chesapeake Bay Program Past Modeling Structure Airshed Model Watershed Model Estuary Model
Yes We Do… New Generation of the Partnership’s Bay Models Airshed Model Watershed Model Estuary Model
… and Then Some Phase 4 Watershed Model Phase 5 Watershed Model
Four Key Questions: • What needs to be done? • Who will be doing it at the state and local scale? • How will it be done? • By when will it be done? Answers in the next generation implementation plans!
What Consequences? • Built into the reasonable assurance framework • To be spelled out by EPA within the Bay TMDL • Asking for contingencies—what’s plan B • Driving an adaptive approach—discard what’s not working and ramp up to the next level • Integral component of the 2-year milestones • Must make up for what’s not achieved and make mid-course changes to implementation
Review Objectives and Strategies Understand Change to Adjust Actions Select Areas To Enhance Actions Identify Partner Activities and Resources Monitor Change and Assess Progress Optimize Actions We Gotta Adapt! • Factor in new, more local data • Develop/apply new tools • Update implementation plans • Amend the Bay TMDL
Implementation or Bust! • Fair share = new allocation methodology • Assign responsibility for taking actions = local allocations • All hands on deck = allocations to source sectors
Implementation or Bust! • Need for accountability for inaction = consequences/contingencies • Adapt or fail = commitment to change as we learn more • The devil is in the details = next generation implementation plans
What’s Up Next? • February 2009 – EPA publishes Notice of Intent to Develop Bay TMDL in Federal Register • May 2009 – Governors/Mayor announce draft refined cap loads, caps by states and the District, new deadline for implementation and 2-year milestones • June 2009-May 2010 – Local governments, local implementors engaged in revising implementation plans, exploring new approaches to closing gaps on what’s needed to restore individual impaired tidal waters • June 2009 – Coordinated EPA/States public outreach begins • May-October 2009 – States allocate nutrient and sediment caps within Bay segments, tributary basins
What’s Up Next? • Nov 2009 – States provide recommended nutrient and sediment allocations to EPA for verification of achievement of states’ Bay water quality standards • Feb-Dec 2010 – States, locals revise tributary strategies to reflect draft allocations • May 2010 – Governors, Mayor announce formal public review of the draft Bay TMDL • June-Sept 2010 – Approximate public comment period for draft TMDL report • Oct-Nov 2010 – Partners’ approval of final Bay TMDL • Dec. 31, 2010 – EPA establishes TMDL by accelerated deadline
No Surprises this Time! • Going to more difficult to reach cap loads and achieve water quality standards this time • Facing the possibility of expanded Bay water quality standards restoration variances • Need to talk about implementation means and mechanisms beyond what exists today including more mandated efforts, new authorities/resources/tools needed
2-Year Milestones Guidelines • Focused on Bay water quality restoration goals • Jurisdiction-specific milestones could be rolled up into a single, basin-wide summary • Possible milestones outcomes include: • Acres of practices implemented • Pounds of pollution reduced • Adoption of new regulations, legislation, policies • Common set of milestone attributes will ensure consistency, accountability and ease of communications • Milestones will be based on the new Bay cleanup deadline
Milestone Attributes • Measurable, trackable, reportable and related to the end goal (cap load allocations) • Translate or relate actions and resources to Bay water quality endpoints • Using ‘common currency’ (e.g., delivered load to tidal waters) • Applying ‘translator tools’ (e.g., Bay watershed model) • Not just limited to ‘pounds reduced’ and ‘acres implemented’ • Need to get at the means for accelerating implementation • Could set milestones for seeking funding, new authorities (e.g., regulation, legislation, policies)
Cleanup Deadline Guiding Principle Cleanup deadline is: “The date by which all the actions required to achieve the jurisdiction-specific and basinwide cap load allocations have been fully implemented on the ground”
Initial Evaluation to Full Implementation • Based on 2000-2008 implementation rates, estimated the jurisdictions would full achieve their nitrogen cap loads by: • 2014: DC • 2020: New York • 2012: Delaware • 2024: West Virginia • 2032 Pennsylvania • 2037: Maryland • 2044: Virginia Analysis conducted for the PSC-October 2008
Initial Evaluation to Full Implementation • Based on doubling of current implementation rates: • DC, New York, Delaware and West Virginia would achieve their nitrogen loading caps by 2020 • Pennsylvania would be at 96% of achievement • Maryland at 93% • Virginia at 81%
Setting the New Deadline • Based on implementation rates used by states’ to set 2-year milestones and anticipated future implementation rates • Factor in projected growth in loads over next two decades • Determine whether to set overall basinwide deadline or jurisdiction-specific deadlines
For PSC April Retreat • Proposed new Bay cleanup deadline • Proposed jurisdictional 2-year milestones • New draft basinwide nutrient/sediment load caps (full attainment of states’ Bay WQ standards) • New draft nutrient/sediment cap load allocations by major tributary basin by jurisdiction
For PSC April Retreat (Con’t) • Information on Bay water quality response to incremental load reductions from current down to draft basinwide caps • Information on maximum feasible implementation levels and resultant loads and Bay WQ response • Information on how the allocations were derived • Explanation of basis for a likely new Bay UAA
For PSC April Retreat (Con’t) • Implications for states’ existing WQ standard regulations and the Bay TMDL under a Bay UAA • Proposed schedule/process leading to December 2010 and Bay TMDL adoption • Local government/ public stakeholder engagement post the May 2009 Executive Council meeting • Continued development of the Bay TMDL and more source sector and geographic specific allocations
Questions for CAC • Does CAC agree with the key components of the Bay TMDL as currently envisioned: local allocations, reasonable assurance, contigencies/consequences, revised implementation plans • Would you recommend the Executive Council announce the draft allocations at the May meeting to start the public engagement process?
Questions for CAC • How do we best engage the public on what’s feasible and the possible trade-off with Bay water quality? • Does the approach to setting the new deadline make sense to CAC? • How do we best communicate the new deadline?
Questions for CAC • How can CAC help ensure the jurisdictions’ 2-year milestones are “a stretch yet achievable”? • Does CAC envision taking on a proactive advisory role at the April PSC retreat? • What roles can CAC take on during the 19 months following the May EC meeting up through final adoption of the Bay TMDL in December 2010?
Contact Information Rich Batiuk Associate Director for Science U.S. Environmental Protection Agency Chesapeake Bay Program Office 410 Severn Avenue, Suite 109Annapolis, MD 21403 410-267-5731 batiuk.richard@epa.gov www.chesapeakebay.net