Download
1 / 21
210 likes | 602 Views
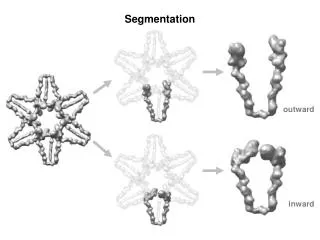
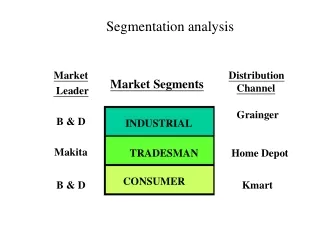
Segmentation Analysis. Segmentation. Assign people to groups/clusters on basis of similarities in characteristics, attributes Bases of segmentation: - Demographic - Behavior - Geographic - Benefit - Product/ Product usage - Purchase

E N D
Segmentation • Assign people to groups/clusters on basis of similarities in characteristics, attributes • Bases of segmentation: - Demographic - Behavior - Geographic - Benefit - Product/ Product usage - Purchase • Here we focus on two techniques used in segmentation
Segmentation: Factor Analysis • Defines underlying structure of data matrix • Summarizes a large no. of var. by identifying a few common underlying dimensions called Factors • Two primary uses:Summarization;Data reduction • It is an interdependence technique • Can be: Exploratory; Confirmatory. • We consider Exploratory view-point.
Segmentation Method: Factor Analysis(contd.) • Six stage model building for F.A. • Stage 1: Research Problem a. Exproratory or confirmatory b. Data summarization or data reduction • Stage 2: Three basic decisions a. Calculation of input data b. Variable selection and measurement issues c. Sample size
Segmentation: Factor Analysis(contd.) • Stage 3: assumptions of F.A. a. Normality b. Linearity c. Ensure data matrix has enough correlations d. Homogeneity of sample e. Conceptual linkages
Segmentation: Factor Analysis(contd.) • Stage 4: Deriving factors and assesing fit. a. Method of extracting factors i. Common F.A. ii. Component F.A. Different types of variances i. Common variance ii. Specific (unique) variance iii. Error
Segmentation: Factor Analysis(contd.) • Stage 4: Deriving factors and assesing fit (contd.). b. Number of factors to extract i. Latent root/eigenvalue ii. %-age of variation iii. Scree test iv. A priori criterion
Segmentation: Factor Analysis(contd.) • Stage 5: Interpreting the factors a. Initial unrotated factors are obtained b. Rotation of factors for better interpretation i. Orthogonal methods - Varimax ii. Oblique methods c. Assess need to respecify factor model
Segmentation: Factor Analysis(contd.) • Criteria for significance of factor loadings - Practical significance - Statistical significance • Interpreting the factor matrix - Examine matrix of loadings - Identify highest loading for each variable - Assess communalities for acceptable levels - Label the factors
Segmentation: Factor Analysis(contd.) • Stage 6: Validation of F.A. a. Move to confirmatory perspective and assess replicability with split-sample or a new sample.
Example: Factor Analysis • A direct mail company sent mailings for an upscale good, based on a commercially available cluster analysis package • Contrary to expectation, response came from middle/lower socioeconomic clusters, not from the top • To verify clustering, the company used census data at the zip code level • 40 census variables were chosen and each of the 2000 New York state zip codes was rated on these • 10 factors (those with eigenvalue>1)were used for further analysis
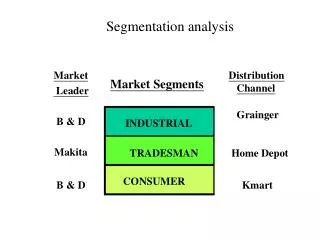
Segmentation:Cluster Analysis • Groups objects into clusters • Only multi variate technique that does not estimate the variate empirically but uses a researcher-specified variate • Focuses on comparison of objects based on variate not on estimation of variate itself • Groups objects whereas Factor Analysis groups variables
Segmentation:Cluster Analysis(contd.) • Six stage model building process • Stage 1: Research problem a. Select objectives i. Taxonomy description ii. Data simplification iii. Relationship identification b. Select clustering var. Include only var.that i. Characterize objects being clustered ii. Relate to objects of C.A.
Segmentation:Cluster Analysis(contd.) • Stage 2: Research design a. Can outliers be detected b. Similarity measures i. Metric data (correlational;distance) ii. Non-metric data (association) c. Standardize data? • Stage 3: Assumptions of C.A. a. Ensure representativeness in sample b. Examine is variables are highly correlated
Segmentation:Cluster Analysis(contd.) • Stage 4: Deriving clusters and assessing fit a. Hierarchical algorithms i. Agglomerative(single linkage, complete linkage, avg. linkage,Ward’s method etc) ii. Divisive(agglomerative in reverse order) b. Non-hierarchical c. Combination
Segmentation:Cluster Analysis(contd.) • Algorithm for K-means clustering 1. Partition items into K clusters 2. Assign items to cluster with nearest centroid mean 3. Recalculate centroids both for cluster receiving and losing item 4. Repeat steps 2 and 3 till no more reassignments
Segmentation:Cluster Analysis(contd.) • How many clusters to form - Stop when similarity measure exceeds certain value - Stop when successive values between steps makes sudden jump - Adopt some statistical test or rule - Researcher’s empirical/theoretical basis
Segmentation:Cluster Analysis(contd.) • Stage 5: Interpretation of clusters a. Examine each cluster w.r.t cluster variate b. Use cluster’s centroid as a measure • Stage 6: Validation and profiling of clusters a. Validation(generalizability, test results on split-sample, predictive validity) b. Profiling(Discriminant analysis with identified clusters as dep. var. & demographics,psychographics as indep.var.)
Example: Cluster Analysis • Stage 1: Objectives To segment HATCO’s customers into groups having similar perceptions of HATCO. Perceptions are based on X1 through X7 • Stage 2: Research Design - No outliers - All 7 variables are metric, so Euclidean distance used as similarity measure - No correlations among variables - All variables on same scale, so no standardization needed
Example: Cluster Analysis • Step 3: Assumptions All assumptions are met • Step 4: Deriving clusters and assessing fit a) Hierarchical method - Both a 2-cluster and a 4-cluster solution selected for further analysis - Tested for distinctiveness of the clusters b) Non Hierarchical method • Step 5: Interpretation of clusters From Factor analysis of X1 through X7 we know that X1, X2, X3 , X7 constitute one dimension (with X1, X3 inversely related to X2, X7 ) and X4 , X6 another dim
Example: Cluster Analysis From Profile Diagram, Cluster 1is higher on X1 and X3 and lower on X2 and X7. Thus cluster 1 is high on dim 1 (Basic value). Also, cluster 2 is high on X4 , X6 i.e on dim 2 (Image) • Step 6: Validation and profiling Clusters profiled on additional variables