1 / 8
80 likes | 105 Views
Get this template plus 350 other premium business tools & templates at www.demandmetric.com

E N D
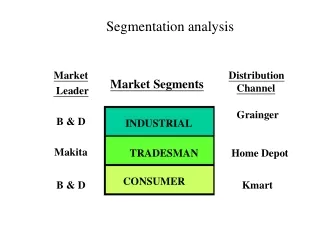
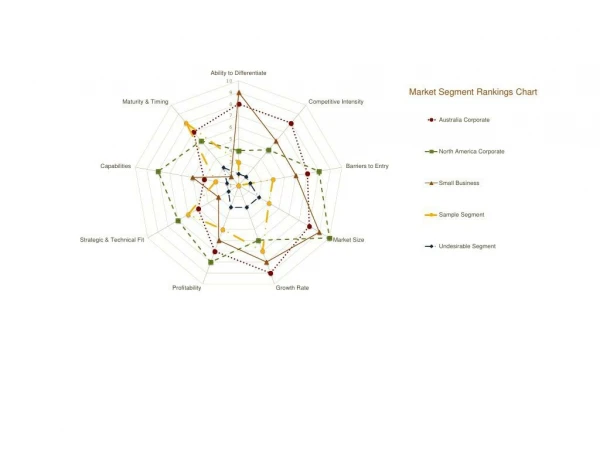
Market Segmentation and Analysis Tool Ability to Differentiate 10 9 Market Segment Rankings Chart Maturity & Timing 8 Competitive Intensity 7 Australia Corporate 6 5 4 North America Corporate 3 Capabilities Barriers to Entry 2 1 Small Business Sample SegmentStrategic & Technical Fit Market Size Undesirable Segment Profitability Growth Rate
Highly Competitive Top PriorityHigh North America Corporate Sample Segment Australia CorporateAttractiveness Bubble Size = Market Opportunity Small Business Undesirable SegmentLow Segments to Ignore Low Competition Low Competitiveness High Highly Competitive Top PriorityHigh North America Corporate Sample Segment Australia CorporateAttractiveness Bubble Size = Market Opportunity Small Business Undesirable SegmentLow Segments to Ignore Low Competition Low Competitiveness High
Company Size (Revenue) Total Addressable Market (TAM) Canada 100M+ Revenue 5-100M Revenue 0-5M Revenue 2,496 184,953 73,895 2,429,133International Markets United States 29,054 1,204,493 784,960 For this example, we have selected a fictional company that sells helpdesk Australia software and is looking to target organizations in English-speaking countries 1,495 78,395 69,392 (USA, Canada and Australia) and do further segmentation based on the size of company (annual revenue). This is designed to give you a sample of how you might want to consider setting up your market sizing and segmentation. Company Size (Revenue) Total Addressable Market (TAM) Canada 100M+ Revenue 5-100M Revenue 0-5M Revenue 2,496 184,953 73,895 2,429,133International Markets United States 29,054 1,204,493 784,960 For this example, we have selected a fictional company that sells helpdesk Australia software and is looking to target organizations in English-speaking countries 1,495 78,395 69,392 (USA, Canada and Australia) and do further segmentation based on the size of company (annual revenue). This is designed to give you a sample of how you might want to consider setting up your market sizing and segmentation.
Company Size (Revenue) Segment Market Segment Sizes 100M+ Revenue 5-100M Revenue 0-5M Revenue 928,247 small businesses in Canada Small Business USA, Canada & Australia North America CorporateInternational Markets United States Small Business North America 1,420,996 mid-sized and large Corporate corporations in USA & Canada Australia Australia Corporate Australia 79,890 mid-sized and large Corporate corporations in Australia Company Size (Revenue) Segment Market Segment Sizes 100M+ Revenue 5-100M Revenue 0-5M Revenue 928,247 small businesses in Canada Small Business USA, Canada & Australia North America CorporateInternational Markets United States Small Business North America 1,420,996 mid-sized and large Corporate corporations in USA & Canada Australia Australia Corporate Australia 79,890 mid-sized and large Corporate corporations in Australia
Market Segmentation & Analysis Tool Weighting Scale Competitiveness Market Opportunity Attractiveness Total Ability to Competitive Barriers to Strategic & Maturity & Market Size Growth Rate Profitability CapabilitiesDifferentiate Intensity Entry Technical Fit Timing 15% 15% 20% 10% 15% 5% 10% 5% 5% 100%Ranking Criteria & Definitions:Ability to Differentiate - is there a specific competitive advantage that you can provide to this market?Competitive Intensity - are there few competitors actively engaged in this market segment? Are they weak?Barriers to Entry - are there any major barriers to entry (technology, patents, distribution, etc)?Market Size - how large is the total addressable market?Growth Rate - what is the anticipated growth rate for this segment?Profitability - are profit margins attractive?Strategic & Technical Fit - how aligned is this market opportunity with our strategic direction?Capabilities - do you have the technical capabilities to effectively compete in this market?Maturity & Timing - how mature is this market? Is now the right time to enter? Market Segmentation & Analysis Tool Weighting Scale Competitiveness Market Opportunity Attractiveness Total Ability to Competitive Barriers to Strategic & Maturity & Market Size Growth Rate Profitability CapabilitiesDifferentiate Intensity Entry Technical Fit Timing 15% 15% 20% 10% 15% 5% 10% 5% 5% 100%Ranking Criteria & Definitions:Ability to Differentiate - is there a specific competitive advantage that you can provide to this market?Competitive Intensity - are there few competitors actively engaged in this market segment? Are they weak?Barriers to Entry - are there any major barriers to entry (technology, patents, distribution, etc)?Market Size - how large is the total addressable market?Growth Rate - what is the anticipated growth rate for this segment?Profitability - are profit margins attractive?Strategic & Technical Fit - how aligned is this market opportunity with our strategic direction?Capabilities - do you have the technical capabilities to effectively compete in this market?Maturity & Timing - how mature is this market? Is now the right time to enter?
Market Segmentation & Analysis Tool Competitiveness Market Opportunity Attractiveness Ability to Competitive Barriers to Strategic & Maturity &Market Segments Differentiate Intensity Entry Market Size Growth Rate Profitability Technical Fit Capabilities TimingWeighting 15% 15% 20% 10% 15% 5% 10% 5% 5%Australia Corporate 8 8 7 8 9 7 5 4 7North America Corporate 4 5 8 10 6 8 7 8 6Small Business 9 6 6 9 8 6 3 5 2Sample Segment 3 1 4 4 7 5 6 3 8Undesirable Segment 2 2 2 3 3 3 2 2 3 Market Segmentation & Analysis Tool Competitiveness Market Opportunity Attractiveness Ability to Competitive Barriers to Strategic & Maturity &Market Segments Differentiate Intensity Entry Market Size Growth Rate Profitability Technical Fit Capabilities TimingWeighting 15% 15% 20% 10% 15% 5% 10% 5% 5%Australia Corporate 8 8 7 8 9 7 5 4 7North America Corporate 4 5 8 10 6 8 7 8 6Small Business 9 6 6 9 8 6 3 5 2Sample Segment 3 1 4 4 7 5 6 3 8Undesirable Segment 2 2 2 3 3 3 2 2 3
Market Segmentation & Analysis ToolNote: Sort by selecting all cells then click "Data"in the navigation menu and "Sort". You can sort by Segment Score (Largest to Smallest). Market Segments Segment Score Competitiveness Market Opportunity Attractiveness Australia Corporate 7.4 3.8 2.5 1.1 North America Corporate 6.7 3.0 2.3 1.4 Small Business 6.5 3.5 2.4 0.7 Sample Segment 4.3 1.4 1.7 1.2 Undesirable Segment 2.4 1.0 0.9 0.5 Market Segmentation & Analysis ToolNote: Sort by selecting all cells then click "Data"in the navigation menu and "Sort". You can sort by Segment Score (Largest to Smallest). Market Segments Segment Score Competitiveness Market Opportunity Attractiveness Australia Corporate 7.4 3.8 2.5 1.1 North America Corporate 6.7 3.0 2.3 1.4 Small Business 6.5 3.5 2.4 0.7 Sample Segment 4.3 1.4 1.7 1.2 Undesirable Segment 2.4 1.0 0.9 0.5
Market Segmentation & Analysis Tool Demographic (who they are) Psychographic (how they think) Behavioural (what they do) Environment (where they are) B2B B2C B2B B2C B2B B2C B2B B2CAnnual Revenue Age Resistance to Change Brand Preferences Website Visits Purchase History Technology Country of Residence# Employees Income Market Focused Price Sensitivity Response to Marketing Where they shop Purchasing Power Political ClimateIndustry Marital Status Open-Minded/Rigid Conservative/Liberal Purchasing Methods Store preferences Management Style Currency# Locations Education Decision Process Enviro-Friendly Memberships Memberships Purchasing Process Payment MethodsYears in Business Family Size Early Adopter Hobbies Internet Usage Internet Usage Purchasing Power Shipping & ReceivingMarkets Served Gender Growth vs. Static Lifestyle Collateral Consumed Impulsiveness Business Culture Languages SpokenProducts/Service Geographic Location Tech Sophistication Information SourcesJob Title Social Circles Professionalism Service PreferenceLevel of Experience Occupation Require Referrals Buy based on trends Awareness of options Spontaneous Risk Aversion Influenced by peers Loyalty Relationships Market Segmentation & Analysis Tool Demographic (who they are) Psychographic (how they think) Behavioural (what they do) Environment (where they are) B2B B2C B2B B2C B2B B2C B2B B2CAnnual Revenue Age Resistance to Change Brand Preferences Website Visits Purchase History Technology Country of Residence# Employees Income Market Focused Price Sensitivity Response to Marketing Where they shop Purchasing Power Political ClimateIndustry Marital Status Open-Minded/Rigid Conservative/Liberal Purchasing Methods Store preferences Management Style Currency# Locations Education Decision Process Enviro-Friendly Memberships Memberships Purchasing Process Payment MethodsYears in Business Family Size Early Adopter Hobbies Internet Usage Internet Usage Purchasing Power Shipping & ReceivingMarkets Served Gender Growth vs. Static Lifestyle Collateral Consumed Impulsiveness Business Culture Languages SpokenProducts/Service Geographic Location Tech Sophistication Information SourcesJob Title Social Circles Professionalism Service PreferenceLevel of Experience Occupation Require Referrals Buy based on trends Awareness of options Spontaneous Risk Aversion Influenced by peers Loyalty Relationships