Segmentation analysis
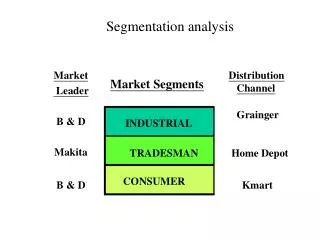
This analysis delves into B&D's segmentation strategy, focusing on market distribution channels like Grainger, Home Depot, and Kmart. It explores color schemes of brands like Makita and Milwaukee and suggests potential strategies for B&D's competitive positioning. The text discusses market share, brand perceptions, and research methods used by B&D. It also examines consumer preferences and blind taste tests to ascertain brand recognition and actual preferences.

Segmentation analysis
E N D
Presentation Transcript
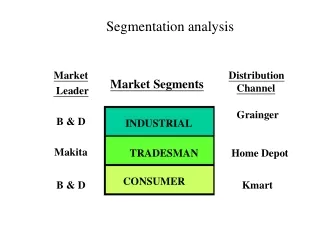
Segmentation analysis Distribution Channel Grainger Home Depot Kmart Market Segments INDUSTRIAL Market Leader B & D Makita B & D TRADESMAN CONSUMER
Color schemes of various brands Figure DColor Differentiation Professional & Tradesman • Makita - Teal • Milwaukee - Red • Bosch – Dark • Hitachi - Green • Black & Decker - Grey Consumer • Wen • Private Label • Black & Decker • Craftsman • Skil
What should B&D do? Concede segment build share Sub-brand Drop B& Dname DeWalt New name
What do you think of this plan? • Do these cosmetic changes really offer any true competitive advantages? How would you respond if you were Makita? Has B&D’s analysis taken this into account? • Does Makita have any real competitive weaknesses to exploit?
% agreeing with statement (Brand X "………….") Table 4Percent Agreeing with the Statement Those Who Prefer Milwaukee Makita B&D Milwaukee B&D Those Who Prefer Makita Makes High-Quality Tools 82% 51% 91% 43% Makes Durable/Rugged Tools 71% 48% 91% 42% Proud to Own 78% 43% 86% 36% Easy to Get Service 68% 66% Stands Behind Products 69% 52% 44% 67% 56% 61%
What Happened? 1991 1994 Makita Other Other Makita Black & Decker DeWalt
Why was it successful? • positioning in terms of service turned their weakness (association with the consumer channel) into a strength because the already existing B&D 117 customer service centers permit DeWalt to make a credible guarantee of 48 hour turn around on repairs. • added value from service guarantee permitted them to charge premium prices (further supporting high quality image)
Market share of tradesman segment Other Makita Black & Decker
What research did B&D do? • visited tradesmen at their job sites • visited Home Depot, and quizzed product demonstrators • conducted lab tests of its performance and reliability • conducted "blind" field testing • analyzed market shares by firm, by channel, & by product type • took a "total product" approach – looked beyond the technical aspects of the tool to evaluate how people felt about using it • understood that tradesmen did not want to be "marketed to“ in a conventional sort of way
The cola "taste test" Group 1 “A" = RC Cola “B" = Coke “C" = Shaw's Group 2 "a" = Coke "b" = Coke "c" = Coke What are some reasons for having such a design?
Coke vs. RC: Stated preferences vs. actual preferences • % preferring • Coke to RC stated actual Preference taste test