Download

1 / 9
90 likes | 119 Views
Learn how Karen Payne used dummy variables for forecasting sales at The Vintage Restaurant on Captiva Island, Florida. Discover the seasonal sales patterns and regression analysis for future predictions.

E N D
Forecasting With Dummy Variables Group 6 Evin Whittington Travis Menn
Case 15.1 The Vintage Restaurant, on Captiva Island near Fort Myers, Florida, is owned and operated by Karen Payne. The restaurant just completed its third year of operation. During that time, Karen sought to establish a reputation for the restaurant as a high-quality dining establish-mentthat specializes in fresh seafood. Through the efforts of Karen and her staff, her restaurant has become one of the best and fastest-growing restaurants on the island.
Time series plot • The time series plot shows higher sales in the beginning of the year. • The sales dip the their low point around the month of November. • This shows a seasonal pattern in the sales.
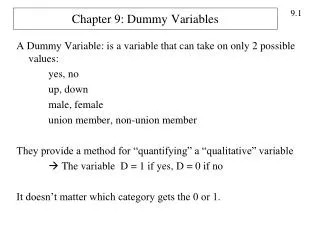
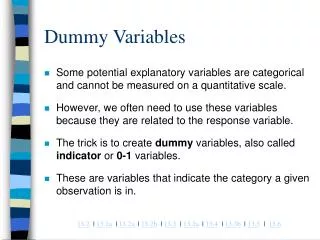
Dummy Variables • To forecast the next year of sales we use dummy variables. • Example of Dummy Variables • Month1 = 1 if January, 0 otherwise • Month2 = 1 if February, 0 otherwise • And so on
Forecasting • With the Summary Output we are able to forecast the next 12 months of sales. • Forecast:
Forecast Error. • The actual sales for January were $295 which gave us a forecasting error of $128.09 • Reasons for that could be the raw data still has seasonal trends in it. • There also could be some 3rd part factors affecting sales.