Dummy Variables
Dummy Variables. Chapter 16.7. Qualitative Explanatory Variables. Multiple regression can be used to study the effects of qualitative variables as well as quantitative Qualitative variables do not assume discrete or continuous numeric values

Dummy Variables
E N D
Presentation Transcript
Dummy Variables Chapter 16.7
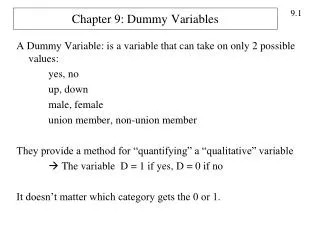
Qualitative Explanatory Variables • Multiple regression can be used to study the effects of qualitative variables as well as quantitative • Qualitative variables do not assume discrete or continuous numeric values • Information on race, gender, industry, a geographic region represent categories into which observations can fall • Qualitative variables are included in a regression by defining a dummy (indicator) variable • A dummy variable is a variable that equals zero or one PP 11
Dummy Variable • Gender is coded as “female” or “male” in the database • Create a new variable • Dgender = 0 if gender = female • Referred to as the omitted group • Omitted group is arbitrary • Dgender = 1 if gender = male • Note that while there are two gender groups, there is only one dummy variable PP 11
Data from CPS for Women and Men • The black dots represent the women and the unfilled dots, the men • The relationship between earnings and education appears to be different • Specifically at each level of education, women earn less • However the slope of the relationship, earn/educ, appears to be the same for both groups Earn Educ PP 11
Dummy Variable • The scatter diagram suggests that there are really two sample regression lines (and presumably) two population regression lines • These regression lines have the same slopes, but different intercepts • We can handle this type of situation by creating a dummy variable PP 11
The Model • Our model is • (1) • The scatter diagram suggests that there are really two sample regression lines (and presumably) two population regression lines • These regression lines have the same slopes, but different intercepts • For women, the model could be • (2) • and for men, the model could be • (3) • where 2 is the extra amount earned by men on average PP 11
Dummy Variable • Using STATA, I ran model (1) and obtained the following sample regression line • (1) • The regression coefficient on education tells me that for every additional year of education, average earnings increase by $2,574.54, controlling for Dgender • Holding education constant, men earn $11,240.39 more than women on average PP 11
Dummy Variable • The use of a dummy variable allows us to pool all our data together, thus increasing sample size • It also allows us to ask whether men earn more (or less) than women, controlling for productivity factors such as education • If men do earn more than women, our results suggest discrimination • Need to look at the significance of the DGENDER variable PP 11
T-test • Perform a t test to ask whether the coefficient on Dgender is significantly different from zero • H0: dgender≤ 0 • H1: dgender > 0 • t = 11240.39/ 132.849 = 84.61 • p -value = 0.000 PP 11